Immigrants from Eritrea vs Icelander Single Mother Households
COMPARE
Immigrants from Eritrea
Icelander
Single Mother Households
Single Mother Households Comparison
Immigrants from Eritrea
Icelanders
6.7%
SINGLE MOTHER HOUSEHOLDS
8.4/ 100
METRIC RATING
212th/ 347
METRIC RANK
6.0%
SINGLE MOTHER HOUSEHOLDS
86.9/ 100
METRIC RATING
138th/ 347
METRIC RANK
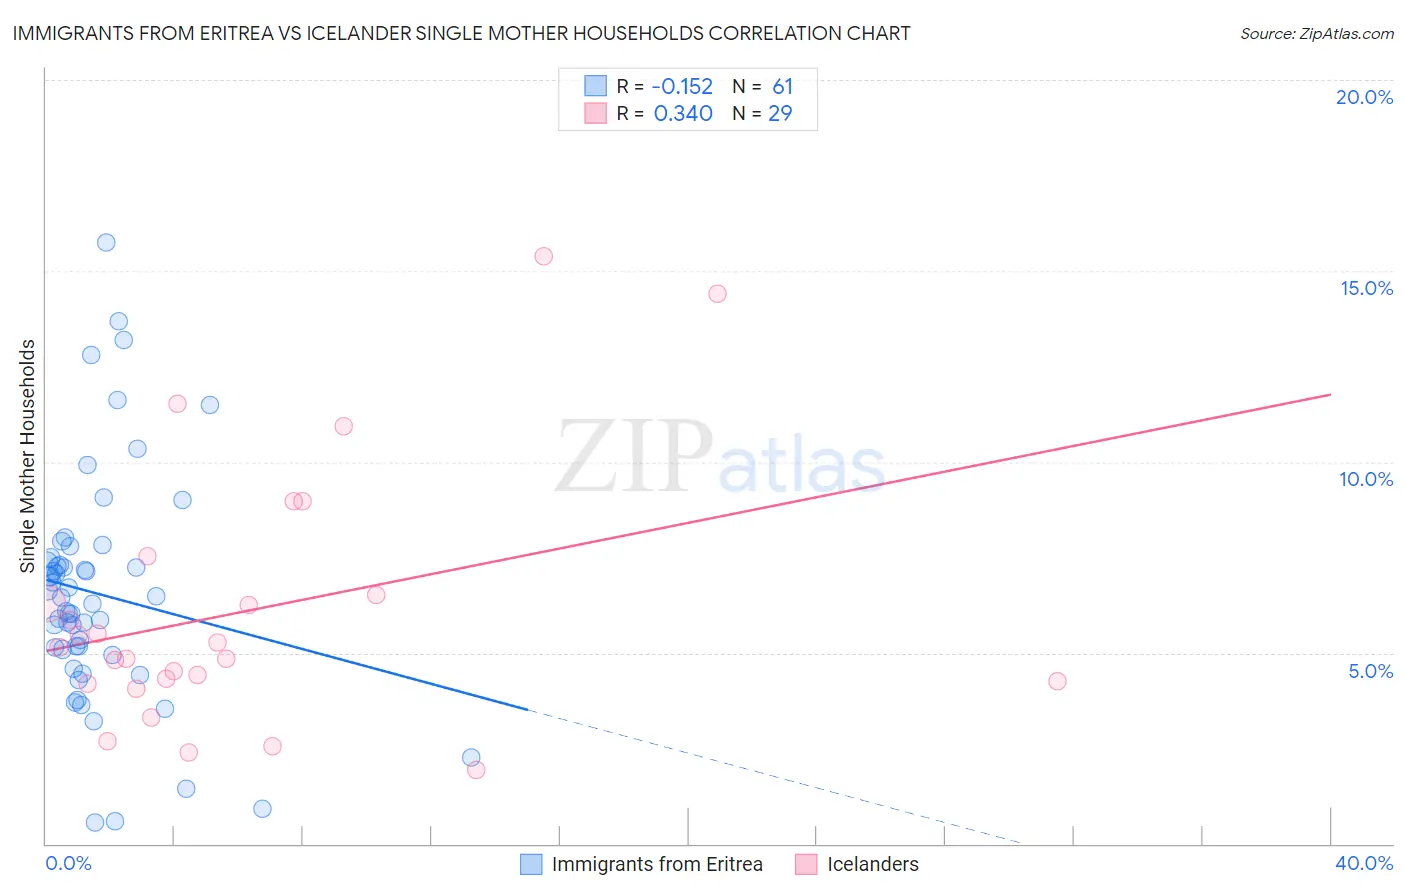
Immigrants from Eritrea vs Icelander Single Mother Households Correlation Chart
The statistical analysis conducted on geographies consisting of 104,781,978 people shows a poor negative correlation between the proportion of Immigrants from Eritrea and percentage of single mother households in the United States with a correlation coefficient (R) of -0.152 and weighted average of 6.7%. Similarly, the statistical analysis conducted on geographies consisting of 159,379,792 people shows a mild positive correlation between the proportion of Icelanders and percentage of single mother households in the United States with a correlation coefficient (R) of 0.340 and weighted average of 6.0%, a difference of 12.4%.
Single Mother Households Correlation Summary
| Measurement | Immigrants from Eritrea | Icelander |
| Minimum | 0.57% | 1.9% |
| Maximum | 15.7% | 15.4% |
| Range | 15.2% | 13.5% |
| Mean | 6.5% | 6.1% |
| Median | 6.5% | 5.1% |
| Interquartile 25% (IQ1) | 5.0% | 4.2% |
| Interquartile 75% (IQ3) | 7.4% | 7.0% |
| Interquartile Range (IQR) | 2.4% | 2.8% |
| Standard Deviation (Sample) | 3.0% | 3.4% |
| Standard Deviation (Population) | 3.0% | 3.3% |
Similar Demographics by Single Mother Households
Demographics Similar to Immigrants from Eritrea by Single Mother Households
In terms of single mother households, the demographic groups most similar to Immigrants from Eritrea are Immigrants from Venezuela (6.7%, a difference of 0.050%), Immigrants from Costa Rica (6.7%, a difference of 0.050%), Immigrants from Uruguay (6.7%, a difference of 0.16%), Nonimmigrants (6.7%, a difference of 0.63%), and Immigrants from Colombia (6.7%, a difference of 0.65%).
| Demographics | Rating | Rank | Single Mother Households |
| Cree | 11.9 /100 | #205 | Poor 6.7% |
| German Russians | 11.5 /100 | #206 | Poor 6.7% |
| Immigrants | South America | 11.5 /100 | #207 | Poor 6.7% |
| Vietnamese | 11.3 /100 | #208 | Poor 6.7% |
| Immigrants | Colombia | 10.5 /100 | #209 | Poor 6.7% |
| Immigrants | Nonimmigrants | 10.4 /100 | #210 | Poor 6.7% |
| Immigrants | Venezuela | 8.5 /100 | #211 | Tragic 6.7% |
| Immigrants | Eritrea | 8.4 /100 | #212 | Tragic 6.7% |
| Immigrants | Costa Rica | 8.2 /100 | #213 | Tragic 6.7% |
| Immigrants | Uruguay | 7.9 /100 | #214 | Tragic 6.7% |
| Shoshone | 5.7 /100 | #215 | Tragic 6.8% |
| Cherokee | 5.1 /100 | #216 | Tragic 6.8% |
| Aleuts | 4.8 /100 | #217 | Tragic 6.8% |
| Immigrants | Eastern Africa | 4.4 /100 | #218 | Tragic 6.8% |
| Immigrants | Immigrants | 4.3 /100 | #219 | Tragic 6.8% |
Demographics Similar to Icelanders by Single Mother Households
In terms of single mother households, the demographic groups most similar to Icelanders are Syrian (6.0%, a difference of 0.23%), French (6.0%, a difference of 0.30%), Tsimshian (6.0%, a difference of 0.40%), Immigrants from Pakistan (6.0%, a difference of 0.41%), and Immigrants from Egypt (6.0%, a difference of 0.45%).
| Demographics | Rating | Rank | Single Mother Households |
| Immigrants | Spain | 91.2 /100 | #131 | Exceptional 5.9% |
| Albanians | 91.1 /100 | #132 | Exceptional 5.9% |
| Egyptians | 90.7 /100 | #133 | Exceptional 5.9% |
| Canadians | 90.5 /100 | #134 | Exceptional 5.9% |
| Immigrants | Saudi Arabia | 90.2 /100 | #135 | Exceptional 5.9% |
| Jordanians | 88.9 /100 | #136 | Excellent 6.0% |
| Immigrants | Pakistan | 88.4 /100 | #137 | Excellent 6.0% |
| Icelanders | 86.9 /100 | #138 | Excellent 6.0% |
| Syrians | 86.0 /100 | #139 | Excellent 6.0% |
| French | 85.7 /100 | #140 | Excellent 6.0% |
| Tsimshian | 85.2 /100 | #141 | Excellent 6.0% |
| Immigrants | Egypt | 85.0 /100 | #142 | Excellent 6.0% |
| Immigrants | Iraq | 84.8 /100 | #143 | Excellent 6.0% |
| Koreans | 84.4 /100 | #144 | Excellent 6.0% |
| Arabs | 84.0 /100 | #145 | Excellent 6.0% |