Immigrants from Eritrea vs Icelander Kindergarten
COMPARE
Immigrants from Eritrea
Icelander
Kindergarten
Kindergarten Comparison
Immigrants from Eritrea
Icelanders
97.2%
KINDERGARTEN
0.0/ 100
METRIC RATING
296th/ 347
METRIC RANK
98.3%
KINDERGARTEN
99.2/ 100
METRIC RATING
81st/ 347
METRIC RANK
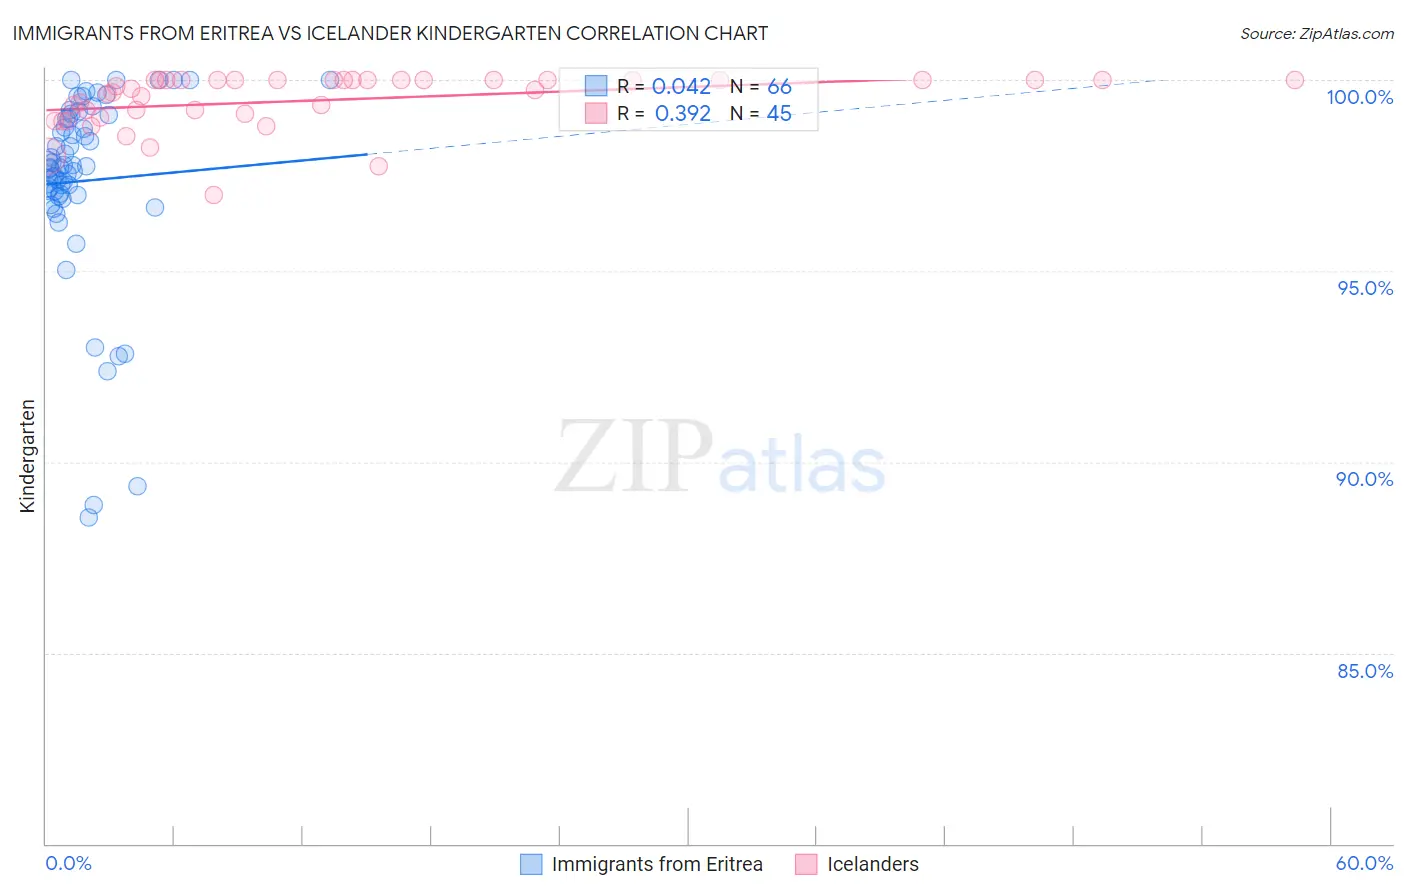
Immigrants from Eritrea vs Icelander Kindergarten Correlation Chart
The statistical analysis conducted on geographies consisting of 104,853,741 people shows no correlation between the proportion of Immigrants from Eritrea and percentage of population with at least kindergarten education in the United States with a correlation coefficient (R) of 0.042 and weighted average of 97.2%. Similarly, the statistical analysis conducted on geographies consisting of 159,668,748 people shows a mild positive correlation between the proportion of Icelanders and percentage of population with at least kindergarten education in the United States with a correlation coefficient (R) of 0.392 and weighted average of 98.3%, a difference of 1.1%.
Kindergarten Correlation Summary
| Measurement | Immigrants from Eritrea | Icelander |
| Minimum | 88.6% | 97.0% |
| Maximum | 100.0% | 100.0% |
| Range | 11.4% | 3.0% |
| Mean | 97.4% | 99.5% |
| Median | 97.7% | 99.8% |
| Interquartile 25% (IQ1) | 97.0% | 99.1% |
| Interquartile 75% (IQ3) | 99.0% | 100.0% |
| Interquartile Range (IQR) | 2.0% | 0.93% |
| Standard Deviation (Sample) | 2.5% | 0.71% |
| Standard Deviation (Population) | 2.5% | 0.71% |
Similar Demographics by Kindergarten
Demographics Similar to Immigrants from Eritrea by Kindergarten
In terms of kindergarten, the demographic groups most similar to Immigrants from Eritrea are Immigrants (97.2%, a difference of 0.010%), Immigrants from Grenada (97.2%, a difference of 0.010%), Malaysian (97.2%, a difference of 0.040%), British West Indian (97.3%, a difference of 0.050%), and Central American Indian (97.2%, a difference of 0.050%).
| Demographics | Rating | Rank | Kindergarten |
| Immigrants | Afghanistan | 0.0 /100 | #289 | Tragic 97.3% |
| Immigrants | St. Vincent and the Grenadines | 0.0 /100 | #290 | Tragic 97.3% |
| Houma | 0.0 /100 | #291 | Tragic 97.3% |
| British West Indians | 0.0 /100 | #292 | Tragic 97.3% |
| Malaysians | 0.0 /100 | #293 | Tragic 97.2% |
| Immigrants | Immigrants | 0.0 /100 | #294 | Tragic 97.2% |
| Immigrants | Grenada | 0.0 /100 | #295 | Tragic 97.2% |
| Immigrants | Eritrea | 0.0 /100 | #296 | Tragic 97.2% |
| Central American Indians | 0.0 /100 | #297 | Tragic 97.2% |
| Immigrants | Dominica | 0.0 /100 | #298 | Tragic 97.1% |
| Immigrants | Cuba | 0.0 /100 | #299 | Tragic 97.1% |
| Haitians | 0.0 /100 | #300 | Tragic 97.1% |
| Immigrants | South Eastern Asia | 0.0 /100 | #301 | Tragic 97.1% |
| Immigrants | Caribbean | 0.0 /100 | #302 | Tragic 97.1% |
| Somalis | 0.0 /100 | #303 | Tragic 97.0% |
Demographics Similar to Icelanders by Kindergarten
In terms of kindergarten, the demographic groups most similar to Icelanders are Shoshone (98.3%, a difference of 0.0%), Immigrants from Belgium (98.3%, a difference of 0.0%), Immigrants from Lithuania (98.3%, a difference of 0.0%), Potawatomi (98.3%, a difference of 0.0%), and Osage (98.3%, a difference of 0.0%).
| Demographics | Rating | Rank | Kindergarten |
| Immigrants | Netherlands | 99.3 /100 | #74 | Exceptional 98.3% |
| Cherokee | 99.3 /100 | #75 | Exceptional 98.3% |
| Immigrants | England | 99.3 /100 | #76 | Exceptional 98.3% |
| Delaware | 99.3 /100 | #77 | Exceptional 98.3% |
| Shoshone | 99.2 /100 | #78 | Exceptional 98.3% |
| Immigrants | Belgium | 99.2 /100 | #79 | Exceptional 98.3% |
| Immigrants | Lithuania | 99.2 /100 | #80 | Exceptional 98.3% |
| Icelanders | 99.2 /100 | #81 | Exceptional 98.3% |
| Potawatomi | 99.2 /100 | #82 | Exceptional 98.3% |
| Osage | 99.1 /100 | #83 | Exceptional 98.3% |
| Immigrants | Denmark | 99.1 /100 | #84 | Exceptional 98.3% |
| Immigrants | Sweden | 99.1 /100 | #85 | Exceptional 98.3% |
| Hopi | 99.0 /100 | #86 | Exceptional 98.3% |
| Immigrants | Australia | 99.0 /100 | #87 | Exceptional 98.3% |
| Ukrainians | 98.8 /100 | #88 | Exceptional 98.3% |