British vs Icelander Single Mother Households
COMPARE
British
Icelander
Single Mother Households
Single Mother Households Comparison
British
Icelanders
5.8%
SINGLE MOTHER HOUSEHOLDS
95.5/ 100
METRIC RATING
110th/ 347
METRIC RANK
6.0%
SINGLE MOTHER HOUSEHOLDS
86.9/ 100
METRIC RATING
138th/ 347
METRIC RANK
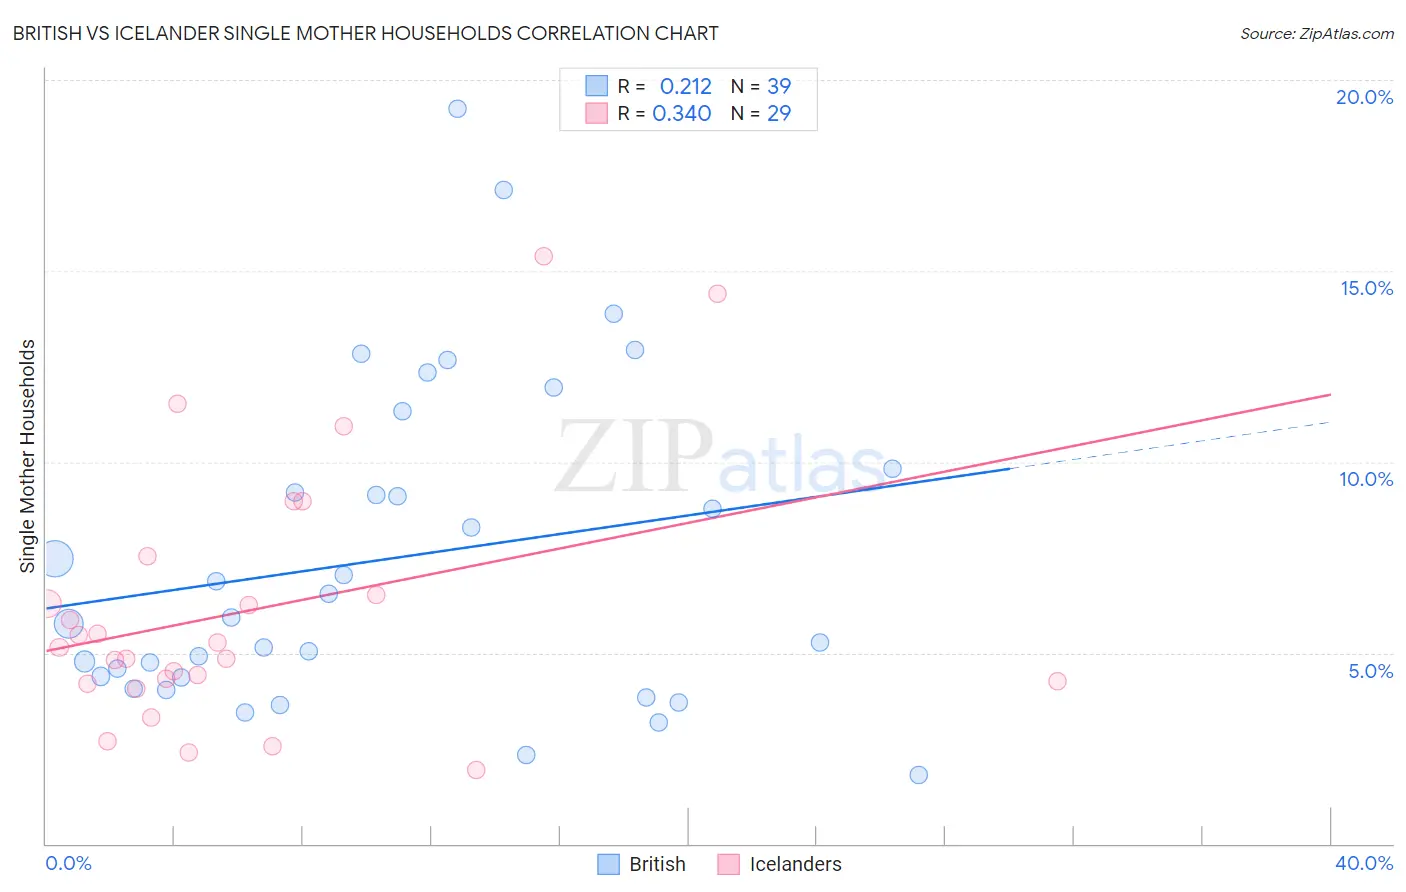
British vs Icelander Single Mother Households Correlation Chart
The statistical analysis conducted on geographies consisting of 528,132,597 people shows a weak positive correlation between the proportion of British and percentage of single mother households in the United States with a correlation coefficient (R) of 0.212 and weighted average of 5.8%. Similarly, the statistical analysis conducted on geographies consisting of 159,379,792 people shows a mild positive correlation between the proportion of Icelanders and percentage of single mother households in the United States with a correlation coefficient (R) of 0.340 and weighted average of 6.0%, a difference of 3.5%.
Single Mother Households Correlation Summary
| Measurement | British | Icelander |
| Minimum | 1.8% | 1.9% |
| Maximum | 19.3% | 15.4% |
| Range | 17.5% | 13.5% |
| Mean | 7.5% | 6.1% |
| Median | 5.9% | 5.1% |
| Interquartile 25% (IQ1) | 4.3% | 4.2% |
| Interquartile 75% (IQ3) | 9.8% | 7.0% |
| Interquartile Range (IQR) | 5.5% | 2.8% |
| Standard Deviation (Sample) | 4.2% | 3.4% |
| Standard Deviation (Population) | 4.1% | 3.3% |
Similar Demographics by Single Mother Households
Demographics Similar to British by Single Mother Households
In terms of single mother households, the demographic groups most similar to British are Immigrants from England (5.8%, a difference of 0.030%), Immigrants from Kuwait (5.8%, a difference of 0.070%), Immigrants from Western Europe (5.8%, a difference of 0.090%), Mongolian (5.8%, a difference of 0.14%), and Immigrants from Italy (5.8%, a difference of 0.18%).
| Demographics | Rating | Rank | Single Mother Households |
| Scottish | 96.2 /100 | #103 | Exceptional 5.8% |
| Northern Europeans | 96.2 /100 | #104 | Exceptional 5.8% |
| Taiwanese | 96.1 /100 | #105 | Exceptional 5.8% |
| Immigrants | Ukraine | 95.9 /100 | #106 | Exceptional 5.8% |
| Paraguayans | 95.8 /100 | #107 | Exceptional 5.8% |
| Immigrants | Italy | 95.8 /100 | #108 | Exceptional 5.8% |
| Immigrants | Western Europe | 95.7 /100 | #109 | Exceptional 5.8% |
| British | 95.5 /100 | #110 | Exceptional 5.8% |
| Immigrants | England | 95.5 /100 | #111 | Exceptional 5.8% |
| Immigrants | Kuwait | 95.4 /100 | #112 | Exceptional 5.8% |
| Mongolians | 95.3 /100 | #113 | Exceptional 5.8% |
| Dutch | 95.1 /100 | #114 | Exceptional 5.8% |
| Irish | 94.8 /100 | #115 | Exceptional 5.8% |
| Pennsylvania Germans | 94.7 /100 | #116 | Exceptional 5.8% |
| Bolivians | 94.6 /100 | #117 | Exceptional 5.8% |
Demographics Similar to Icelanders by Single Mother Households
In terms of single mother households, the demographic groups most similar to Icelanders are Syrian (6.0%, a difference of 0.23%), French (6.0%, a difference of 0.30%), Tsimshian (6.0%, a difference of 0.40%), Immigrants from Pakistan (6.0%, a difference of 0.41%), and Immigrants from Egypt (6.0%, a difference of 0.45%).
| Demographics | Rating | Rank | Single Mother Households |
| Immigrants | Spain | 91.2 /100 | #131 | Exceptional 5.9% |
| Albanians | 91.1 /100 | #132 | Exceptional 5.9% |
| Egyptians | 90.7 /100 | #133 | Exceptional 5.9% |
| Canadians | 90.5 /100 | #134 | Exceptional 5.9% |
| Immigrants | Saudi Arabia | 90.2 /100 | #135 | Exceptional 5.9% |
| Jordanians | 88.9 /100 | #136 | Excellent 6.0% |
| Immigrants | Pakistan | 88.4 /100 | #137 | Excellent 6.0% |
| Icelanders | 86.9 /100 | #138 | Excellent 6.0% |
| Syrians | 86.0 /100 | #139 | Excellent 6.0% |
| French | 85.7 /100 | #140 | Excellent 6.0% |
| Tsimshian | 85.2 /100 | #141 | Excellent 6.0% |
| Immigrants | Egypt | 85.0 /100 | #142 | Excellent 6.0% |
| Immigrants | Iraq | 84.8 /100 | #143 | Excellent 6.0% |
| Koreans | 84.4 /100 | #144 | Excellent 6.0% |
| Arabs | 84.0 /100 | #145 | Excellent 6.0% |