Immigrants from Eritrea vs Immigrants from Laos Single Mother Households
COMPARE
Immigrants from Eritrea
Immigrants from Laos
Single Mother Households
Single Mother Households Comparison
Immigrants from Eritrea
Immigrants from Laos
6.7%
SINGLE MOTHER HOUSEHOLDS
8.4/ 100
METRIC RATING
212th/ 347
METRIC RANK
7.7%
SINGLE MOTHER HOUSEHOLDS
0.0/ 100
METRIC RATING
281st/ 347
METRIC RANK
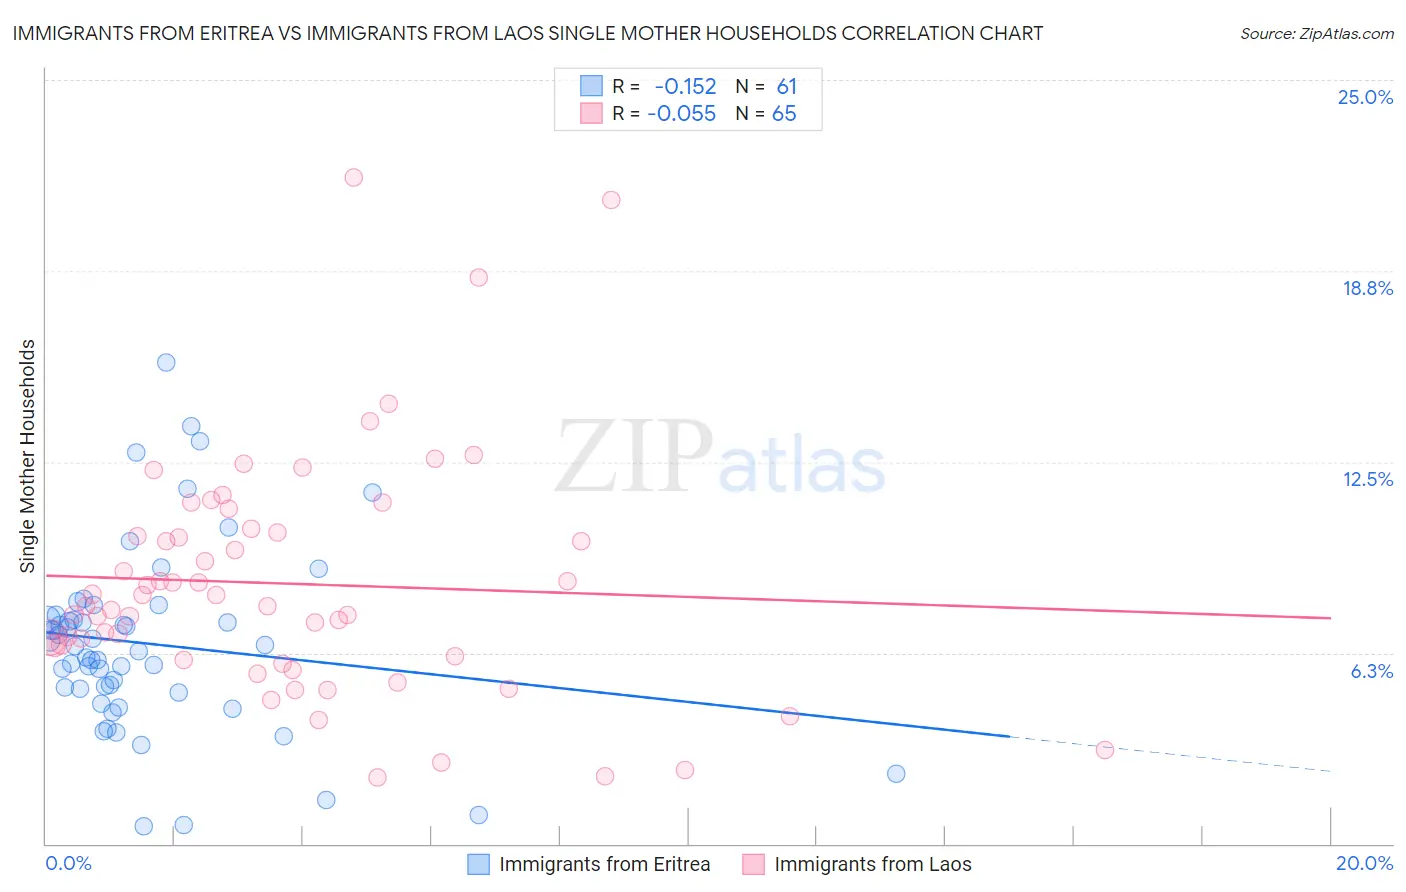
Immigrants from Eritrea vs Immigrants from Laos Single Mother Households Correlation Chart
The statistical analysis conducted on geographies consisting of 104,781,978 people shows a poor negative correlation between the proportion of Immigrants from Eritrea and percentage of single mother households in the United States with a correlation coefficient (R) of -0.152 and weighted average of 6.7%. Similarly, the statistical analysis conducted on geographies consisting of 201,339,065 people shows a slight negative correlation between the proportion of Immigrants from Laos and percentage of single mother households in the United States with a correlation coefficient (R) of -0.055 and weighted average of 7.7%, a difference of 14.0%.
Single Mother Households Correlation Summary
| Measurement | Immigrants from Eritrea | Immigrants from Laos |
| Minimum | 0.57% | 2.2% |
| Maximum | 15.7% | 21.8% |
| Range | 15.2% | 19.6% |
| Mean | 6.5% | 8.5% |
| Median | 6.5% | 7.8% |
| Interquartile 25% (IQ1) | 5.0% | 6.1% |
| Interquartile 75% (IQ3) | 7.4% | 10.3% |
| Interquartile Range (IQR) | 2.4% | 4.2% |
| Standard Deviation (Sample) | 3.0% | 3.9% |
| Standard Deviation (Population) | 3.0% | 3.9% |
Similar Demographics by Single Mother Households
Demographics Similar to Immigrants from Eritrea by Single Mother Households
In terms of single mother households, the demographic groups most similar to Immigrants from Eritrea are Immigrants from Venezuela (6.7%, a difference of 0.050%), Immigrants from Costa Rica (6.7%, a difference of 0.050%), Immigrants from Uruguay (6.7%, a difference of 0.16%), Nonimmigrants (6.7%, a difference of 0.63%), and Immigrants from Colombia (6.7%, a difference of 0.65%).
| Demographics | Rating | Rank | Single Mother Households |
| Cree | 11.9 /100 | #205 | Poor 6.7% |
| German Russians | 11.5 /100 | #206 | Poor 6.7% |
| Immigrants | South America | 11.5 /100 | #207 | Poor 6.7% |
| Vietnamese | 11.3 /100 | #208 | Poor 6.7% |
| Immigrants | Colombia | 10.5 /100 | #209 | Poor 6.7% |
| Immigrants | Nonimmigrants | 10.4 /100 | #210 | Poor 6.7% |
| Immigrants | Venezuela | 8.5 /100 | #211 | Tragic 6.7% |
| Immigrants | Eritrea | 8.4 /100 | #212 | Tragic 6.7% |
| Immigrants | Costa Rica | 8.2 /100 | #213 | Tragic 6.7% |
| Immigrants | Uruguay | 7.9 /100 | #214 | Tragic 6.7% |
| Shoshone | 5.7 /100 | #215 | Tragic 6.8% |
| Cherokee | 5.1 /100 | #216 | Tragic 6.8% |
| Aleuts | 4.8 /100 | #217 | Tragic 6.8% |
| Immigrants | Eastern Africa | 4.4 /100 | #218 | Tragic 6.8% |
| Immigrants | Immigrants | 4.3 /100 | #219 | Tragic 6.8% |
Demographics Similar to Immigrants from Laos by Single Mother Households
In terms of single mother households, the demographic groups most similar to Immigrants from Laos are Immigrants from Sierra Leone (7.7%, a difference of 0.0%), Guatemalan (7.7%, a difference of 0.020%), Nigerian (7.7%, a difference of 0.050%), Immigrants from El Salvador (7.6%, a difference of 0.52%), and Immigrants from Belize (7.7%, a difference of 0.65%).
| Demographics | Rating | Rank | Single Mother Households |
| Immigrants | Guyana | 0.1 /100 | #274 | Tragic 7.6% |
| Central American Indians | 0.1 /100 | #275 | Tragic 7.6% |
| Guyanese | 0.1 /100 | #276 | Tragic 7.6% |
| Immigrants | Trinidad and Tobago | 0.1 /100 | #277 | Tragic 7.6% |
| Central Americans | 0.1 /100 | #278 | Tragic 7.6% |
| Immigrants | El Salvador | 0.0 /100 | #279 | Tragic 7.6% |
| Immigrants | Sierra Leone | 0.0 /100 | #280 | Tragic 7.7% |
| Immigrants | Laos | 0.0 /100 | #281 | Tragic 7.7% |
| Guatemalans | 0.0 /100 | #282 | Tragic 7.7% |
| Nigerians | 0.0 /100 | #283 | Tragic 7.7% |
| Immigrants | Belize | 0.0 /100 | #284 | Tragic 7.7% |
| Trinidadians and Tobagonians | 0.0 /100 | #285 | Tragic 7.7% |
| Immigrants | Middle Africa | 0.0 /100 | #286 | Tragic 7.7% |
| Immigrants | Guatemala | 0.0 /100 | #287 | Tragic 7.7% |
| Sierra Leoneans | 0.0 /100 | #288 | Tragic 7.7% |