Immigrants from Egypt vs Northern European Single Father Households
COMPARE
Immigrants from Egypt
Northern European
Single Father Households
Single Father Households Comparison
Immigrants from Egypt
Northern Europeans
2.1%
SINGLE FATHER HOUSEHOLDS
99.8/ 100
METRIC RATING
74th/ 347
METRIC RANK
2.2%
SINGLE FATHER HOUSEHOLDS
89.8/ 100
METRIC RATING
146th/ 347
METRIC RANK
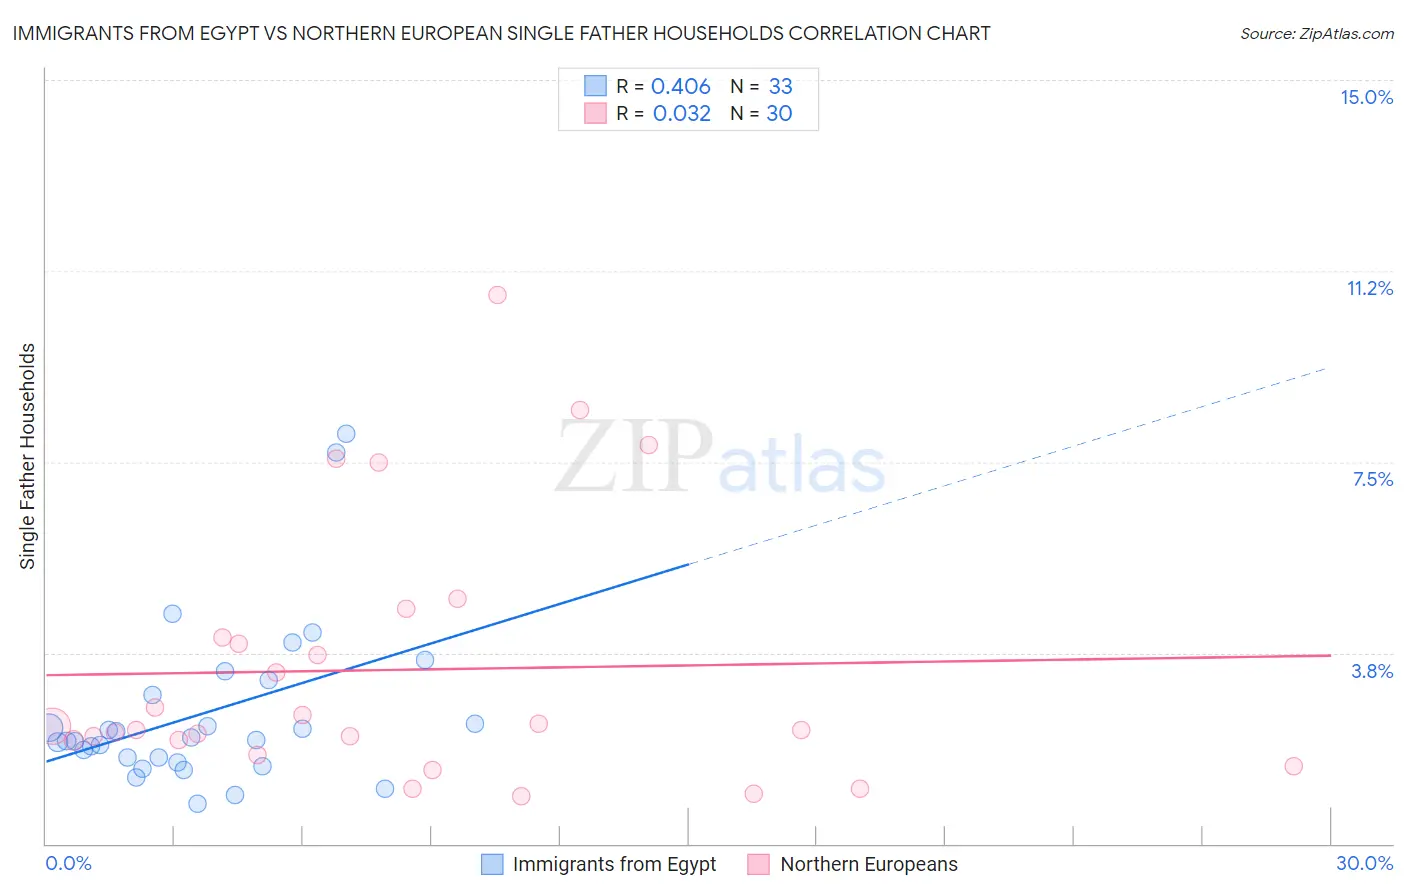
Immigrants from Egypt vs Northern European Single Father Households Correlation Chart
The statistical analysis conducted on geographies consisting of 244,264,821 people shows a moderate positive correlation between the proportion of Immigrants from Egypt and percentage of single father households in the United States with a correlation coefficient (R) of 0.406 and weighted average of 2.1%. Similarly, the statistical analysis conducted on geographies consisting of 401,873,140 people shows no correlation between the proportion of Northern Europeans and percentage of single father households in the United States with a correlation coefficient (R) of 0.032 and weighted average of 2.2%, a difference of 8.4%.
Single Father Households Correlation Summary
| Measurement | Immigrants from Egypt | Northern European |
| Minimum | 0.78% | 0.95% |
| Maximum | 8.1% | 10.8% |
| Range | 7.3% | 9.8% |
| Mean | 2.6% | 3.4% |
| Median | 2.0% | 2.3% |
| Interquartile 25% (IQ1) | 1.7% | 2.0% |
| Interquartile 75% (IQ3) | 3.1% | 4.0% |
| Interquartile Range (IQR) | 1.4% | 2.0% |
| Standard Deviation (Sample) | 1.6% | 2.5% |
| Standard Deviation (Population) | 1.6% | 2.5% |
Similar Demographics by Single Father Households
Demographics Similar to Immigrants from Egypt by Single Father Households
In terms of single father households, the demographic groups most similar to Immigrants from Egypt are Immigrants from Bangladesh (2.1%, a difference of 0.0%), Immigrants from Kuwait (2.1%, a difference of 0.15%), Immigrants from Spain (2.1%, a difference of 0.15%), Egyptian (2.1%, a difference of 0.16%), and Immigrants from Sweden (2.1%, a difference of 0.28%).
| Demographics | Rating | Rank | Single Father Households |
| Immigrants | Italy | 99.8 /100 | #67 | Exceptional 2.1% |
| Immigrants | Denmark | 99.8 /100 | #68 | Exceptional 2.1% |
| Immigrants | Romania | 99.8 /100 | #69 | Exceptional 2.1% |
| Egyptians | 99.8 /100 | #70 | Exceptional 2.1% |
| Immigrants | Kuwait | 99.8 /100 | #71 | Exceptional 2.1% |
| Immigrants | Spain | 99.8 /100 | #72 | Exceptional 2.1% |
| Immigrants | Bangladesh | 99.8 /100 | #73 | Exceptional 2.1% |
| Immigrants | Egypt | 99.8 /100 | #74 | Exceptional 2.1% |
| Immigrants | Sweden | 99.8 /100 | #75 | Exceptional 2.1% |
| Immigrants | Scotland | 99.8 /100 | #76 | Exceptional 2.1% |
| Immigrants | Saudi Arabia | 99.8 /100 | #77 | Exceptional 2.1% |
| Estonians | 99.7 /100 | #78 | Exceptional 2.1% |
| Immigrants | Asia | 99.7 /100 | #79 | Exceptional 2.1% |
| Immigrants | South Africa | 99.7 /100 | #80 | Exceptional 2.1% |
| Armenians | 99.7 /100 | #81 | Exceptional 2.1% |
Demographics Similar to Northern Europeans by Single Father Households
In terms of single father households, the demographic groups most similar to Northern Europeans are Immigrants from Zimbabwe (2.2%, a difference of 0.080%), Slavic (2.2%, a difference of 0.18%), Slovak (2.2%, a difference of 0.19%), South American Indian (2.3%, a difference of 0.27%), and Senegalese (2.3%, a difference of 0.28%).
| Demographics | Rating | Rank | Single Father Households |
| Brazilians | 92.8 /100 | #139 | Exceptional 2.2% |
| British | 92.8 /100 | #140 | Exceptional 2.2% |
| Laotians | 92.5 /100 | #141 | Exceptional 2.2% |
| Luxembourgers | 92.3 /100 | #142 | Exceptional 2.2% |
| Immigrants | Nepal | 92.1 /100 | #143 | Exceptional 2.2% |
| Slovaks | 90.7 /100 | #144 | Exceptional 2.2% |
| Immigrants | Zimbabwe | 90.2 /100 | #145 | Exceptional 2.2% |
| Northern Europeans | 89.8 /100 | #146 | Excellent 2.2% |
| Slavs | 88.9 /100 | #147 | Excellent 2.2% |
| South American Indians | 88.5 /100 | #148 | Excellent 2.3% |
| Senegalese | 88.4 /100 | #149 | Excellent 2.3% |
| Venezuelans | 86.2 /100 | #150 | Excellent 2.3% |
| Immigrants | Syria | 84.8 /100 | #151 | Excellent 2.3% |
| Immigrants | Venezuela | 83.2 /100 | #152 | Excellent 2.3% |
| Immigrants | Germany | 82.8 /100 | #153 | Excellent 2.3% |