Immigrants from Egypt vs Slovene Single Father Households
COMPARE
Immigrants from Egypt
Slovene
Single Father Households
Single Father Households Comparison
Immigrants from Egypt
Slovenes
2.1%
SINGLE FATHER HOUSEHOLDS
99.8/ 100
METRIC RATING
74th/ 347
METRIC RANK
2.2%
SINGLE FATHER HOUSEHOLDS
98.5/ 100
METRIC RATING
107th/ 347
METRIC RANK
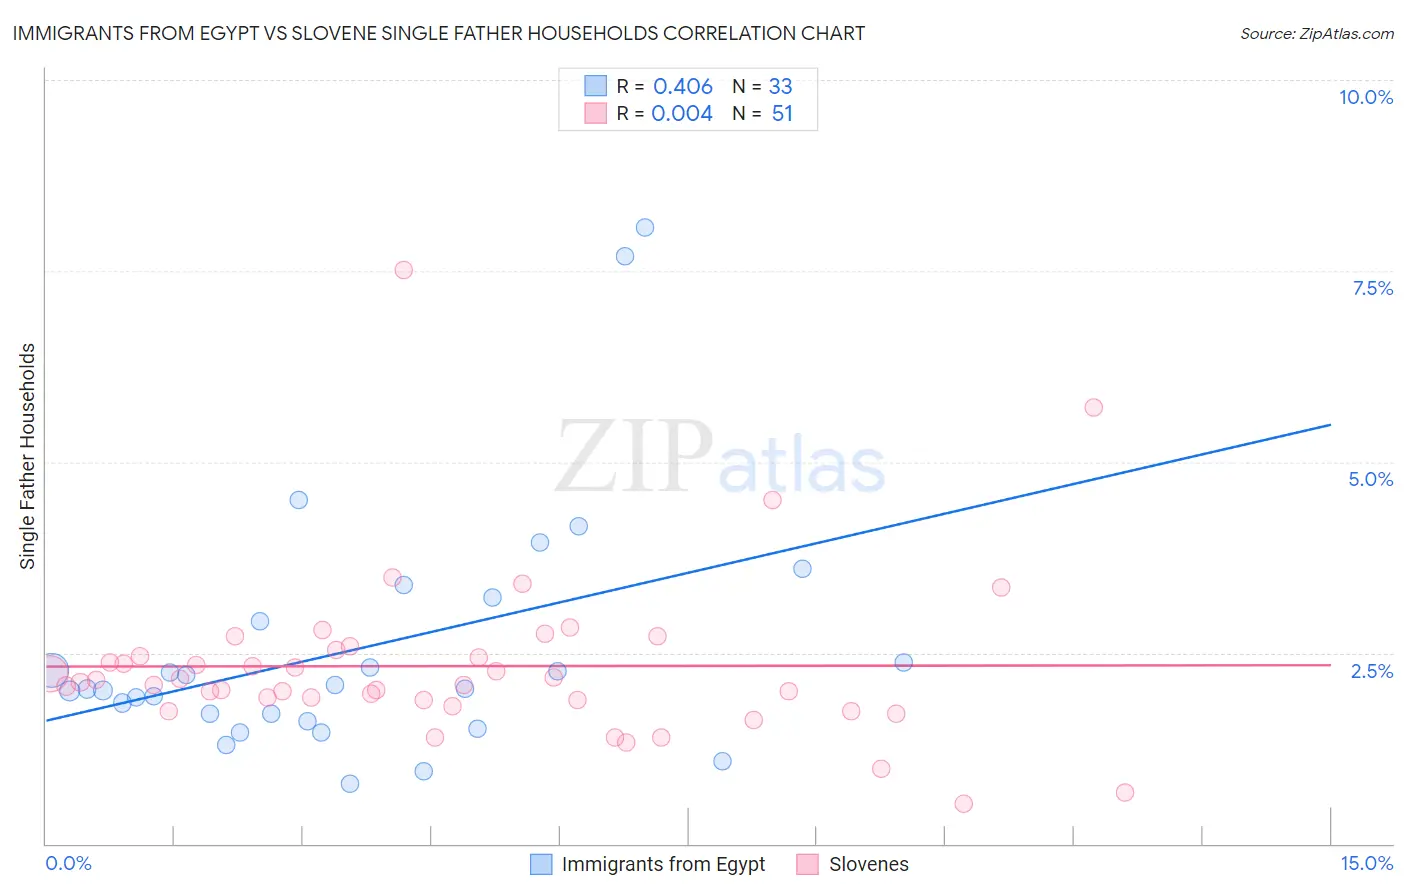
Immigrants from Egypt vs Slovene Single Father Households Correlation Chart
The statistical analysis conducted on geographies consisting of 244,264,821 people shows a moderate positive correlation between the proportion of Immigrants from Egypt and percentage of single father households in the United States with a correlation coefficient (R) of 0.406 and weighted average of 2.1%. Similarly, the statistical analysis conducted on geographies consisting of 259,682,092 people shows no correlation between the proportion of Slovenes and percentage of single father households in the United States with a correlation coefficient (R) of 0.004 and weighted average of 2.2%, a difference of 4.3%.
Single Father Households Correlation Summary
| Measurement | Immigrants from Egypt | Slovene |
| Minimum | 0.78% | 0.52% |
| Maximum | 8.1% | 7.5% |
| Range | 7.3% | 7.0% |
| Mean | 2.6% | 2.3% |
| Median | 2.0% | 2.1% |
| Interquartile 25% (IQ1) | 1.7% | 1.9% |
| Interquartile 75% (IQ3) | 3.1% | 2.5% |
| Interquartile Range (IQR) | 1.4% | 0.66% |
| Standard Deviation (Sample) | 1.6% | 1.1% |
| Standard Deviation (Population) | 1.6% | 1.1% |
Similar Demographics by Single Father Households
Demographics Similar to Immigrants from Egypt by Single Father Households
In terms of single father households, the demographic groups most similar to Immigrants from Egypt are Immigrants from Bangladesh (2.1%, a difference of 0.0%), Immigrants from Kuwait (2.1%, a difference of 0.15%), Immigrants from Spain (2.1%, a difference of 0.15%), Egyptian (2.1%, a difference of 0.16%), and Immigrants from Sweden (2.1%, a difference of 0.28%).
| Demographics | Rating | Rank | Single Father Households |
| Immigrants | Italy | 99.8 /100 | #67 | Exceptional 2.1% |
| Immigrants | Denmark | 99.8 /100 | #68 | Exceptional 2.1% |
| Immigrants | Romania | 99.8 /100 | #69 | Exceptional 2.1% |
| Egyptians | 99.8 /100 | #70 | Exceptional 2.1% |
| Immigrants | Kuwait | 99.8 /100 | #71 | Exceptional 2.1% |
| Immigrants | Spain | 99.8 /100 | #72 | Exceptional 2.1% |
| Immigrants | Bangladesh | 99.8 /100 | #73 | Exceptional 2.1% |
| Immigrants | Egypt | 99.8 /100 | #74 | Exceptional 2.1% |
| Immigrants | Sweden | 99.8 /100 | #75 | Exceptional 2.1% |
| Immigrants | Scotland | 99.8 /100 | #76 | Exceptional 2.1% |
| Immigrants | Saudi Arabia | 99.8 /100 | #77 | Exceptional 2.1% |
| Estonians | 99.7 /100 | #78 | Exceptional 2.1% |
| Immigrants | Asia | 99.7 /100 | #79 | Exceptional 2.1% |
| Immigrants | South Africa | 99.7 /100 | #80 | Exceptional 2.1% |
| Armenians | 99.7 /100 | #81 | Exceptional 2.1% |
Demographics Similar to Slovenes by Single Father Households
In terms of single father households, the demographic groups most similar to Slovenes are Immigrants from Netherlands (2.2%, a difference of 0.020%), Barbadian (2.2%, a difference of 0.060%), Immigrants from Southern Europe (2.2%, a difference of 0.11%), Italian (2.2%, a difference of 0.19%), and Palestinian (2.2%, a difference of 0.23%).
| Demographics | Rating | Rank | Single Father Households |
| Immigrants | Northern Africa | 99.0 /100 | #100 | Exceptional 2.1% |
| Immigrants | Western Europe | 98.9 /100 | #101 | Exceptional 2.1% |
| Argentineans | 98.9 /100 | #102 | Exceptional 2.1% |
| Lebanese | 98.9 /100 | #103 | Exceptional 2.1% |
| Alsatians | 98.9 /100 | #104 | Exceptional 2.1% |
| Palestinians | 98.6 /100 | #105 | Exceptional 2.2% |
| Immigrants | Southern Europe | 98.6 /100 | #106 | Exceptional 2.2% |
| Slovenes | 98.5 /100 | #107 | Exceptional 2.2% |
| Immigrants | Netherlands | 98.5 /100 | #108 | Exceptional 2.2% |
| Barbadians | 98.4 /100 | #109 | Exceptional 2.2% |
| Italians | 98.3 /100 | #110 | Exceptional 2.2% |
| Immigrants | Canada | 98.3 /100 | #111 | Exceptional 2.2% |
| Immigrants | Trinidad and Tobago | 98.2 /100 | #112 | Exceptional 2.2% |
| Iraqis | 98.2 /100 | #113 | Exceptional 2.2% |
| Immigrants | North America | 98.2 /100 | #114 | Exceptional 2.2% |