Immigrants from Ecuador vs Cajun Single Father Households
COMPARE
Immigrants from Ecuador
Cajun
Single Father Households
Single Father Households Comparison
Immigrants from Ecuador
Cajuns
2.4%
SINGLE FATHER HOUSEHOLDS
14.9/ 100
METRIC RATING
216th/ 347
METRIC RANK
2.5%
SINGLE FATHER HOUSEHOLDS
6.1/ 100
METRIC RATING
236th/ 347
METRIC RANK
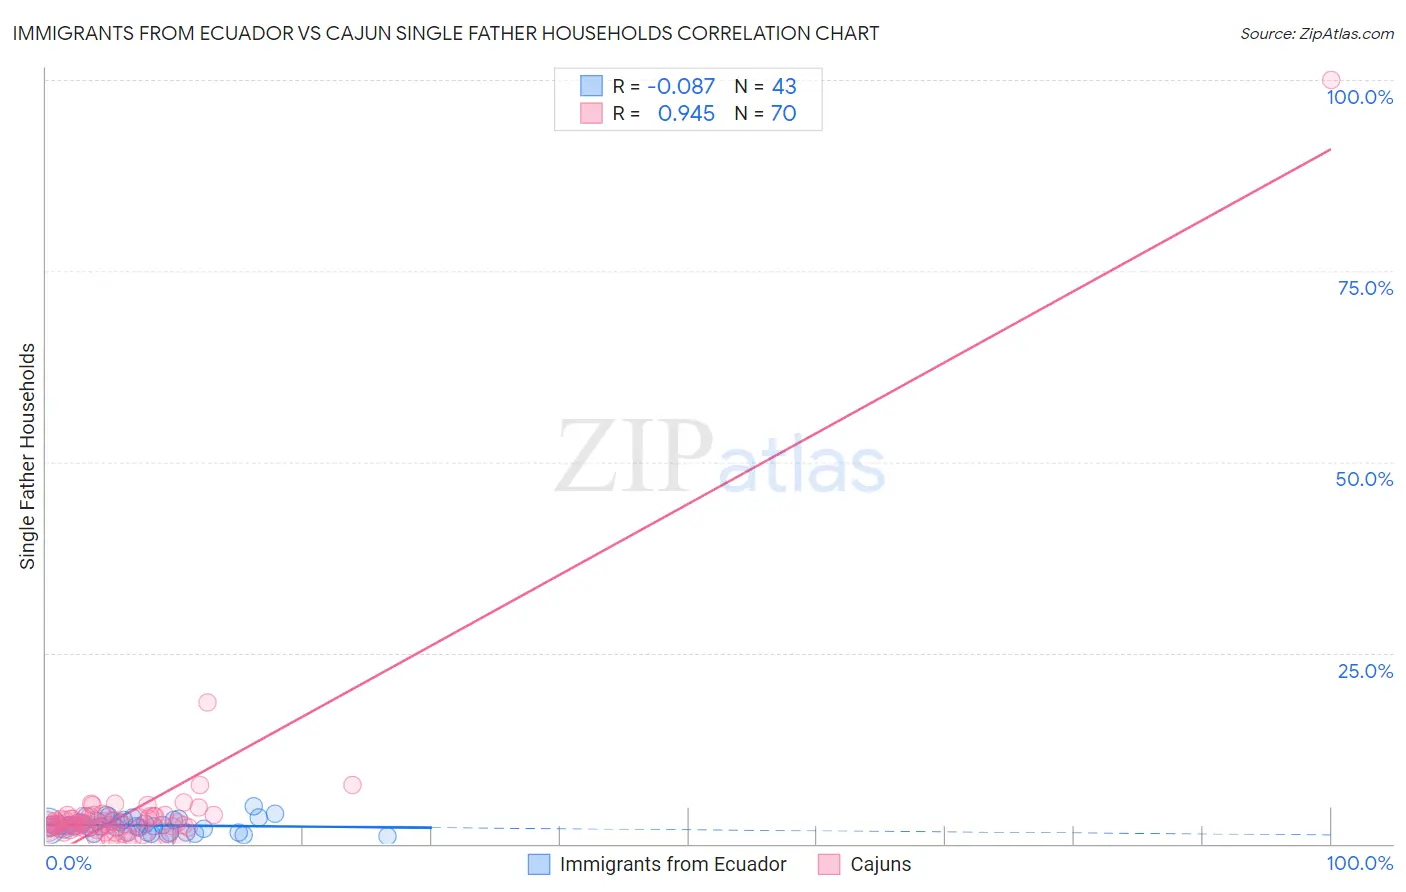
Immigrants from Ecuador vs Cajun Single Father Households Correlation Chart
The statistical analysis conducted on geographies consisting of 269,379,294 people shows a slight negative correlation between the proportion of Immigrants from Ecuador and percentage of single father households in the United States with a correlation coefficient (R) of -0.087 and weighted average of 2.4%. Similarly, the statistical analysis conducted on geographies consisting of 148,931,799 people shows a near-perfect positive correlation between the proportion of Cajuns and percentage of single father households in the United States with a correlation coefficient (R) of 0.945 and weighted average of 2.5%, a difference of 1.8%.
Single Father Households Correlation Summary
| Measurement | Immigrants from Ecuador | Cajun |
| Minimum | 0.94% | 0.066% |
| Maximum | 4.9% | 100.0% |
| Range | 3.9% | 99.9% |
| Mean | 2.4% | 4.4% |
| Median | 2.3% | 2.6% |
| Interquartile 25% (IQ1) | 1.5% | 2.1% |
| Interquartile 75% (IQ3) | 2.9% | 3.6% |
| Interquartile Range (IQR) | 1.4% | 1.5% |
| Standard Deviation (Sample) | 0.87% | 11.8% |
| Standard Deviation (Population) | 0.86% | 11.8% |
Demographics Similar to Immigrants from Ecuador and Cajuns by Single Father Households
In terms of single father households, the demographic groups most similar to Immigrants from Ecuador are Dutch (2.4%, a difference of 0.090%), Immigrants from Ethiopia (2.4%, a difference of 0.22%), Sudanese (2.4%, a difference of 0.29%), Ghanaian (2.4%, a difference of 0.30%), and Immigrants from Burma/Myanmar (2.4%, a difference of 0.43%). Similarly, the demographic groups most similar to Cajuns are Immigrants (2.5%, a difference of 0.050%), African (2.5%, a difference of 0.070%), Immigrants from Western Africa (2.4%, a difference of 0.27%), Pennsylvania German (2.4%, a difference of 0.33%), and Nonimmigrants (2.4%, a difference of 0.41%).
| Demographics | Rating | Rank | Single Father Households |
| Immigrants | Ecuador | 14.9 /100 | #216 | Poor 2.4% |
| Dutch | 14.3 /100 | #217 | Poor 2.4% |
| Immigrants | Ethiopia | 13.4 /100 | #218 | Poor 2.4% |
| Sudanese | 13.0 /100 | #219 | Poor 2.4% |
| Ghanaians | 12.9 /100 | #220 | Poor 2.4% |
| Immigrants | Burma/Myanmar | 12.1 /100 | #221 | Poor 2.4% |
| Immigrants | Eastern Africa | 11.9 /100 | #222 | Poor 2.4% |
| Immigrants | Uruguay | 11.0 /100 | #223 | Poor 2.4% |
| Immigrants | Bahamas | 10.6 /100 | #224 | Poor 2.4% |
| Marshallese | 9.7 /100 | #225 | Tragic 2.4% |
| Blacks/African Americans | 9.7 /100 | #226 | Tragic 2.4% |
| Americans | 9.3 /100 | #227 | Tragic 2.4% |
| Immigrants | Ghana | 9.1 /100 | #228 | Tragic 2.4% |
| Immigrants | Zaire | 8.6 /100 | #229 | Tragic 2.4% |
| Sub-Saharan Africans | 8.3 /100 | #230 | Tragic 2.4% |
| Immigrants | Nonimmigrants | 7.6 /100 | #231 | Tragic 2.4% |
| Pennsylvania Germans | 7.3 /100 | #232 | Tragic 2.4% |
| Immigrants | Western Africa | 7.0 /100 | #233 | Tragic 2.4% |
| Africans | 6.3 /100 | #234 | Tragic 2.5% |
| Immigrants | Immigrants | 6.3 /100 | #235 | Tragic 2.5% |
| Cajuns | 6.1 /100 | #236 | Tragic 2.5% |