Immigrants from Dominica vs Immigrants from Serbia Divorced or Separated
COMPARE
Immigrants from Dominica
Immigrants from Serbia
Divorced or Separated
Divorced or Separated Comparison
Immigrants from Dominica
Immigrants from Serbia
12.6%
DIVORCED OR SEPARATED
0.5/ 100
METRIC RATING
261st/ 347
METRIC RANK
11.6%
DIVORCED OR SEPARATED
98.8/ 100
METRIC RATING
95th/ 347
METRIC RANK
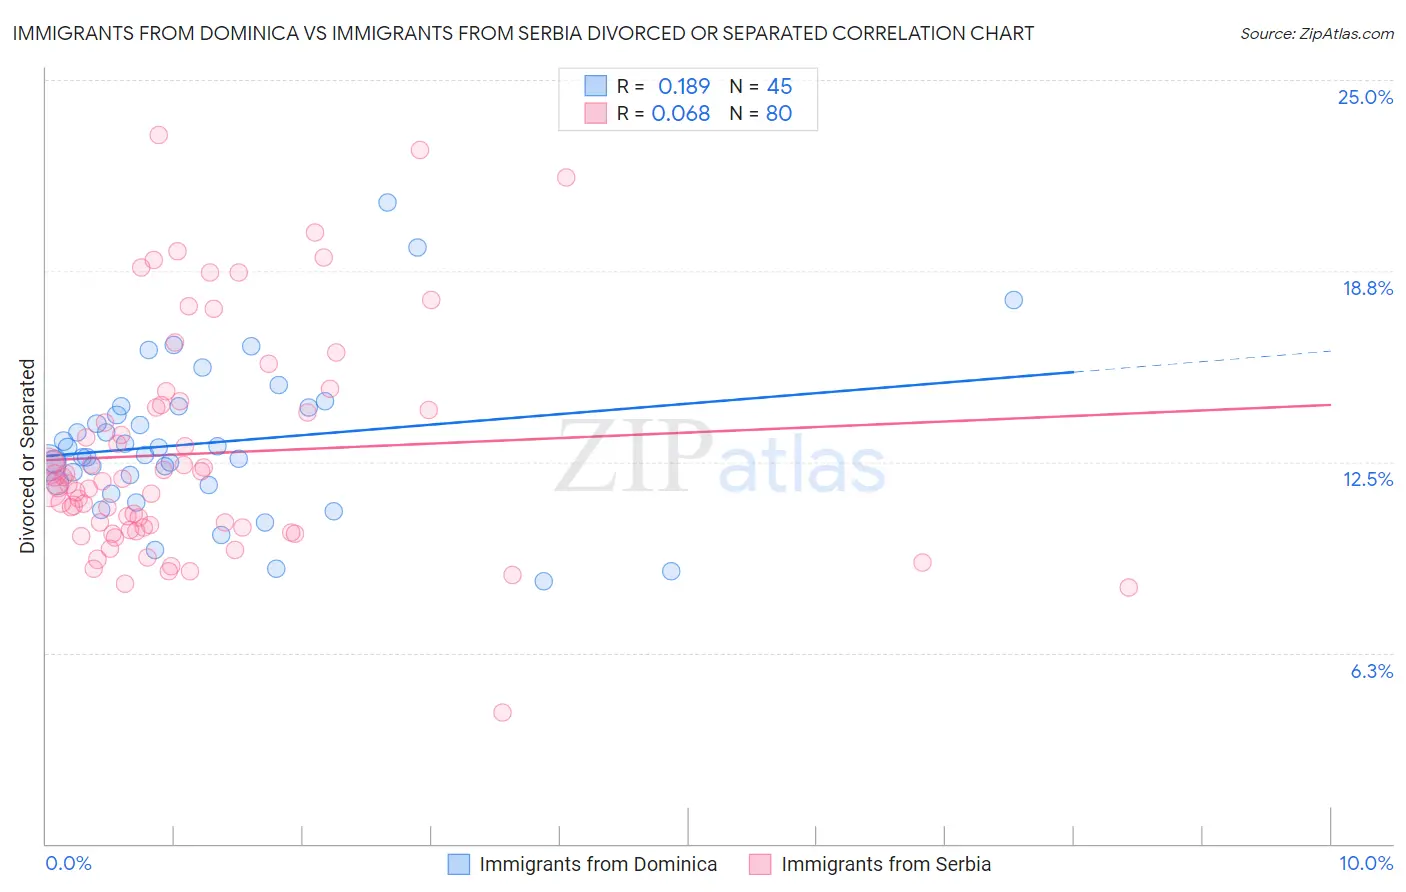
Immigrants from Dominica vs Immigrants from Serbia Divorced or Separated Correlation Chart
The statistical analysis conducted on geographies consisting of 83,792,024 people shows a poor positive correlation between the proportion of Immigrants from Dominica and percentage of population currently divorced or separated in the United States with a correlation coefficient (R) of 0.189 and weighted average of 12.6%. Similarly, the statistical analysis conducted on geographies consisting of 131,725,275 people shows a slight positive correlation between the proportion of Immigrants from Serbia and percentage of population currently divorced or separated in the United States with a correlation coefficient (R) of 0.068 and weighted average of 11.6%, a difference of 8.6%.
Divorced or Separated Correlation Summary
| Measurement | Immigrants from Dominica | Immigrants from Serbia |
| Minimum | 8.6% | 4.3% |
| Maximum | 21.0% | 23.2% |
| Range | 12.4% | 18.9% |
| Mean | 13.1% | 12.8% |
| Median | 12.7% | 11.8% |
| Interquartile 25% (IQ1) | 11.8% | 10.3% |
| Interquartile 75% (IQ3) | 14.3% | 14.3% |
| Interquartile Range (IQR) | 2.5% | 4.0% |
| Standard Deviation (Sample) | 2.5% | 3.7% |
| Standard Deviation (Population) | 2.5% | 3.6% |
Similar Demographics by Divorced or Separated
Demographics Similar to Immigrants from Dominica by Divorced or Separated
In terms of divorced or separated, the demographic groups most similar to Immigrants from Dominica are Yuman (12.6%, a difference of 0.030%), Immigrants from Uruguay (12.6%, a difference of 0.030%), Immigrants from Somalia (12.6%, a difference of 0.050%), Indonesian (12.6%, a difference of 0.050%), and Basque (12.6%, a difference of 0.060%).
| Demographics | Rating | Rank | Divorced or Separated |
| Senegalese | 0.8 /100 | #254 | Tragic 12.6% |
| Welsh | 0.7 /100 | #255 | Tragic 12.6% |
| Immigrants | Colombia | 0.6 /100 | #256 | Tragic 12.6% |
| Immigrants | Somalia | 0.6 /100 | #257 | Tragic 12.6% |
| Indonesians | 0.6 /100 | #258 | Tragic 12.6% |
| Yuman | 0.6 /100 | #259 | Tragic 12.6% |
| Immigrants | Uruguay | 0.6 /100 | #260 | Tragic 12.6% |
| Immigrants | Dominica | 0.5 /100 | #261 | Tragic 12.6% |
| Basques | 0.5 /100 | #262 | Tragic 12.6% |
| Immigrants | Panama | 0.5 /100 | #263 | Tragic 12.6% |
| English | 0.5 /100 | #264 | Tragic 12.6% |
| Immigrants | Senegal | 0.5 /100 | #265 | Tragic 12.6% |
| Whites/Caucasians | 0.5 /100 | #266 | Tragic 12.6% |
| Scottish | 0.4 /100 | #267 | Tragic 12.6% |
| Fijians | 0.4 /100 | #268 | Tragic 12.6% |
Demographics Similar to Immigrants from Serbia by Divorced or Separated
In terms of divorced or separated, the demographic groups most similar to Immigrants from Serbia are Immigrants from Ukraine (11.6%, a difference of 0.020%), Latvian (11.6%, a difference of 0.050%), Immigrants from Jordan (11.6%, a difference of 0.090%), Immigrants from Fiji (11.6%, a difference of 0.10%), and Immigrants from Sweden (11.6%, a difference of 0.10%).
| Demographics | Rating | Rank | Divorced or Separated |
| Immigrants | Europe | 99.2 /100 | #88 | Exceptional 11.6% |
| Immigrants | Southern Europe | 99.1 /100 | #89 | Exceptional 11.6% |
| Zimbabweans | 99.0 /100 | #90 | Exceptional 11.6% |
| Spanish American Indians | 99.0 /100 | #91 | Exceptional 11.6% |
| Immigrants | Denmark | 98.9 /100 | #92 | Exceptional 11.6% |
| Arabs | 98.9 /100 | #93 | Exceptional 11.6% |
| Immigrants | Fiji | 98.9 /100 | #94 | Exceptional 11.6% |
| Immigrants | Serbia | 98.8 /100 | #95 | Exceptional 11.6% |
| Immigrants | Ukraine | 98.7 /100 | #96 | Exceptional 11.6% |
| Latvians | 98.7 /100 | #97 | Exceptional 11.6% |
| Immigrants | Jordan | 98.6 /100 | #98 | Exceptional 11.6% |
| Immigrants | Sweden | 98.6 /100 | #99 | Exceptional 11.6% |
| Immigrants | Northern Europe | 98.6 /100 | #100 | Exceptional 11.6% |
| Immigrants | Guyana | 98.5 /100 | #101 | Exceptional 11.6% |
| Immigrants | Croatia | 98.3 /100 | #102 | Exceptional 11.6% |