Immigrants from Dominica vs Bangladeshi Unemployment Among Youth under 25 years
COMPARE
Immigrants from Dominica
Bangladeshi
Unemployment Among Youth under 25 years
Unemployment Among Youth under 25 years Comparison
Immigrants from Dominica
Bangladeshis
14.6%
UNEMPLOYMENT AMONG YOUTH UNDER 25 YEARS
0.0/ 100
METRIC RATING
318th/ 347
METRIC RANK
11.6%
UNEMPLOYMENT AMONG YOUTH UNDER 25 YEARS
55.6/ 100
METRIC RATING
171st/ 347
METRIC RANK
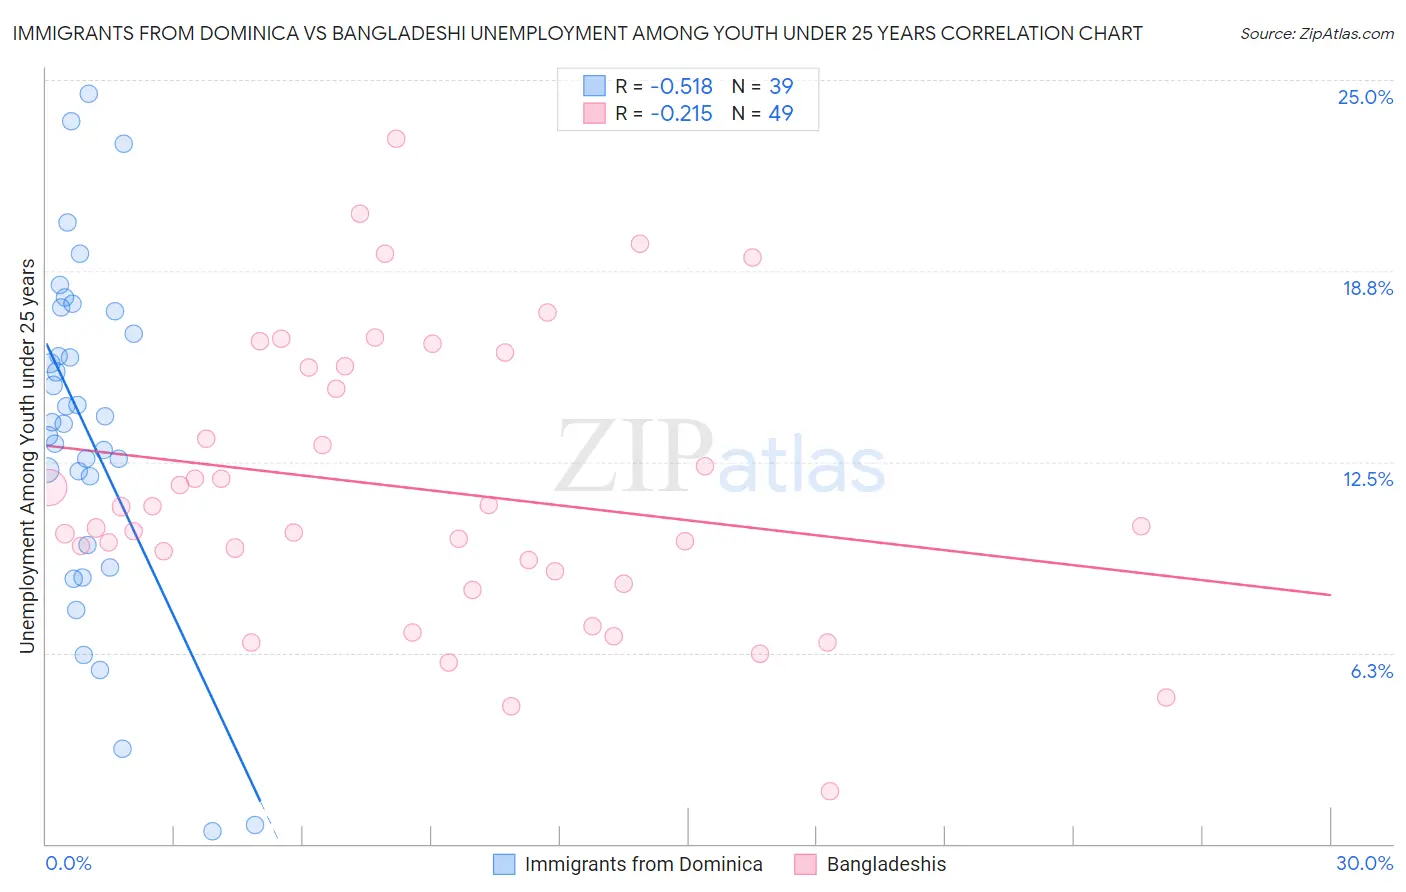
Immigrants from Dominica vs Bangladeshi Unemployment Among Youth under 25 years Correlation Chart
The statistical analysis conducted on geographies consisting of 83,611,163 people shows a substantial negative correlation between the proportion of Immigrants from Dominica and unemployment rate among youth under the age of 25 in the United States with a correlation coefficient (R) of -0.518 and weighted average of 14.6%. Similarly, the statistical analysis conducted on geographies consisting of 140,831,540 people shows a weak negative correlation between the proportion of Bangladeshis and unemployment rate among youth under the age of 25 in the United States with a correlation coefficient (R) of -0.215 and weighted average of 11.6%, a difference of 25.9%.
Unemployment Among Youth under 25 years Correlation Summary
| Measurement | Immigrants from Dominica | Bangladeshi |
| Minimum | 0.40% | 1.7% |
| Maximum | 24.6% | 23.1% |
| Range | 24.2% | 21.4% |
| Mean | 13.5% | 11.6% |
| Median | 13.8% | 10.4% |
| Interquartile 25% (IQ1) | 9.8% | 8.7% |
| Interquartile 75% (IQ3) | 17.4% | 15.6% |
| Interquartile Range (IQR) | 7.7% | 6.9% |
| Standard Deviation (Sample) | 5.6% | 4.6% |
| Standard Deviation (Population) | 5.6% | 4.6% |
Similar Demographics by Unemployment Among Youth under 25 years
Demographics Similar to Immigrants from Dominica by Unemployment Among Youth under 25 years
In terms of unemployment among youth under 25 years, the demographic groups most similar to Immigrants from Dominica are West Indian (14.6%, a difference of 0.040%), Barbadian (14.6%, a difference of 0.080%), Cheyenne (14.6%, a difference of 0.24%), Trinidadian and Tobagonian (14.6%, a difference of 0.31%), and Immigrants from Trinidad and Tobago (14.6%, a difference of 0.40%).
| Demographics | Rating | Rank | Unemployment Among Youth under 25 years |
| Immigrants | Bangladesh | 0.0 /100 | #311 | Tragic 14.2% |
| Vietnamese | 0.0 /100 | #312 | Tragic 14.3% |
| Immigrants | Armenia | 0.0 /100 | #313 | Tragic 14.4% |
| Jamaicans | 0.0 /100 | #314 | Tragic 14.4% |
| Sioux | 0.0 /100 | #315 | Tragic 14.4% |
| Natives/Alaskans | 0.0 /100 | #316 | Tragic 14.5% |
| Blacks/African Americans | 0.0 /100 | #317 | Tragic 14.5% |
| Immigrants | Dominica | 0.0 /100 | #318 | Tragic 14.6% |
| West Indians | 0.0 /100 | #319 | Tragic 14.6% |
| Barbadians | 0.0 /100 | #320 | Tragic 14.6% |
| Cheyenne | 0.0 /100 | #321 | Tragic 14.6% |
| Trinidadians and Tobagonians | 0.0 /100 | #322 | Tragic 14.6% |
| Immigrants | Trinidad and Tobago | 0.0 /100 | #323 | Tragic 14.6% |
| Immigrants | Jamaica | 0.0 /100 | #324 | Tragic 14.8% |
| Alaska Natives | 0.0 /100 | #325 | Tragic 14.9% |
Demographics Similar to Bangladeshis by Unemployment Among Youth under 25 years
In terms of unemployment among youth under 25 years, the demographic groups most similar to Bangladeshis are Immigrants from Morocco (11.6%, a difference of 0.020%), Russian (11.6%, a difference of 0.070%), Eastern European (11.6%, a difference of 0.080%), Potawatomi (11.6%, a difference of 0.10%), and Okinawan (11.6%, a difference of 0.13%).
| Demographics | Rating | Rank | Unemployment Among Youth under 25 years |
| Immigrants | Laos | 62.4 /100 | #164 | Good 11.5% |
| Immigrants | Sweden | 61.3 /100 | #165 | Good 11.5% |
| Spanish | 60.3 /100 | #166 | Good 11.6% |
| Okinawans | 58.7 /100 | #167 | Average 11.6% |
| Potawatomi | 57.9 /100 | #168 | Average 11.6% |
| Eastern Europeans | 57.5 /100 | #169 | Average 11.6% |
| Russians | 57.3 /100 | #170 | Average 11.6% |
| Bangladeshis | 55.6 /100 | #171 | Average 11.6% |
| Immigrants | Morocco | 55.1 /100 | #172 | Average 11.6% |
| Immigrants | South Eastern Asia | 51.7 /100 | #173 | Average 11.6% |
| Immigrants | China | 50.0 /100 | #174 | Average 11.6% |
| Immigrants | Iraq | 47.0 /100 | #175 | Average 11.6% |
| Ugandans | 45.6 /100 | #176 | Average 11.6% |
| Immigrants | Denmark | 45.0 /100 | #177 | Average 11.6% |
| Immigrants | Europe | 42.4 /100 | #178 | Average 11.6% |