Immigrants from Denmark vs Basque Single Mother Households

COMPARE

Immigrants from Denmark
Race
Ancestry
AfghanAfricanAlaska NativeAlaskan AthabascanAlbanianAleutAlsatianAmericanApacheArabArapahoArgentineanArmenianAssyrian/Chaldean/SyriacAustralianAustrianBahamianBangladeshiBarbadianBelgianBelizeanBermudanBhutaneseBlackfeetBolivianBrazilianBritishBritish West IndianBulgarianBurmeseCajunCambodianCanadianCape VerdeanCarpatho RusynCelticCentral AmericanCentral American IndianCherokeeCheyenneChickasawChileanChineseChippewaChoctawColombianColvilleComancheCosta RicanCreeCreekCroatianCrowCubanCypriotCzechCzechoslovakianDanishDelawareDominicanDutchDutch West IndianEastern EuropeanEcuadorianEgyptianEnglishEstonianEthiopianEuropeanFijianFilipinoFinnishFrenchFrench American IndianFrench CanadianGermanGerman RussianGhanaianGreekGuamanian/ChamorroGuatemalanGuyaneseHaitianHmongHonduranHopiHoumaHungarianIcelanderIndian (Asian)IndonesianInupiatIranianIraqiIrishIroquoisIsraeliItalianJamaicanJapaneseJordanianKenyanKiowaKoreanLaotianLatvianLebaneseLiberianLithuanianLumbeeLuxembourgerMacedonianMalaysianMalteseMarshalleseMenomineeMexicanMexican American IndianMongolianMoroccanNative HawaiianNavajoNepaleseNew ZealanderNicaraguanNigerianNorthern EuropeanNorwegianOkinawanOsageOttawaPaiutePakistaniPalestinianPanamanianParaguayanPennsylvania GermanPeruvianPimaPolishPortuguesePotawatomiPuebloPuerto RicanPuget Sound SalishRomanianRussianSalvadoranSamoanScandinavianScotch-IrishScottishSeminoleSenegaleseSerbianShoshoneSierra LeoneanSiouxSlavicSlovakSloveneSomaliSouth AfricanSouth AmericanSouth American IndianSoviet UnionSpaniardSpanishSpanish AmericanSpanish American IndianSri LankanSubsaharan AfricanSudaneseSwedishSwissSyrianTaiwaneseThaiTlingit-HaidaTohono O'OdhamTonganTrinidadian and TobagonianTsimshianTurkishU.S. Virgin IslanderUgandanUkrainianUruguayanUteVenezuelanVietnameseWelshWest IndianYakamaYaquiYugoslavianYumanYup'ikZimbabwean
Immigration
NonimmigrantsImmigrantsAfghanistanAfricaAlbaniaArgentinaArmeniaAsiaAustraliaAustriaBahamasBangladeshBarbadosBelarusBelgiumBelizeBoliviaBosnia and HerzegovinaBrazilBulgariaBurma/MyanmarCabo VerdeCambodiaCameroonCanadaCaribbeanCentral AmericaChileChinaColombiaCongoCosta RicaCroatiaCubaCzechoslovakiaDenmarkDominicaDominican RepublicEastern AfricaEastern AsiaEastern EuropeEcuadorEgyptEl SalvadorEnglandEritreaEthiopiaEuropeFijiFranceGermanyGhanaGreeceGrenadaGuatemalaGuyanaHaitiHondurasHong KongHungaryIndiaIndonesiaIranIraqIrelandIsraelItalyJamaicaJapanJordanKazakhstanKenyaKoreaKuwaitLaosLatin AmericaLatviaLebanonLiberiaLithuaniaMalaysiaMexicoMicronesiaMiddle AfricaMoldovaMoroccoNepalNetherlandsNicaraguaNigeriaNorth AmericaNorth MacedoniaNorthern AfricaNorthern EuropeNorwayOceaniaPakistanPanamaPeruPhilippinesPolandPortugalRomaniaRussiaSaudi ArabiaScotlandSenegalSerbiaSierra LeoneSingaporeSomaliaSouth AfricaSouth AmericaSouth Central AsiaSouth Eastern AsiaSouthern EuropeSpainSri LankaSt. Vincent and the GrenadinesSudanSwedenSwitzerlandSyriaTaiwanThailandTrinidad and TobagoTurkeyUgandaUkraineUruguayUzbekistanVenezuelaVietnamWest IndiesWestern AfricaWestern AsiaWestern EuropeYemenZaireZimbabweAzores
Basque
Race
Ancestry
AfghanAfricanAlaska NativeAlaskan AthabascanAlbanianAleutAlsatianAmericanApacheArabArapahoArgentineanArmenianAssyrian/Chaldean/SyriacAustralianAustrianBahamianBangladeshiBarbadianBasqueBelgianBelizeanBermudanBhutaneseBlackfeetBolivianBrazilianBritishBritish West IndianBulgarianBurmeseCajunCambodianCanadianCape VerdeanCarpatho RusynCelticCentral AmericanCentral American IndianCherokeeCheyenneChickasawChileanChineseChippewaChoctawColombianColvilleComancheCosta RicanCreeCreekCroatianCrowCubanCypriotCzechCzechoslovakianDanishDelawareDominicanDutchDutch West IndianEastern EuropeanEcuadorianEgyptianEnglishEstonianEthiopianEuropeanFijianFilipinoFinnishFrenchFrench American IndianFrench CanadianGermanGerman RussianGhanaianGreekGuamanian/ChamorroGuatemalanGuyaneseHaitianHmongHonduranHopiHoumaHungarianIcelanderIndian (Asian)IndonesianInupiatIranianIraqiIrishIroquoisIsraeliItalianJamaicanJapaneseJordanianKenyanKiowaKoreanLaotianLatvianLebaneseLiberianLithuanianLumbeeLuxembourgerMacedonianMalaysianMalteseMarshalleseMenomineeMexicanMexican American IndianMongolianMoroccanNative HawaiianNavajoNepaleseNew ZealanderNicaraguanNigerianNorthern EuropeanNorwegianOkinawanOsageOttawaPaiutePakistaniPalestinianPanamanianParaguayanPennsylvania GermanPeruvianPimaPolishPortuguesePotawatomiPuebloPuerto RicanPuget Sound SalishRomanianRussianSalvadoranSamoanScandinavianScotch-IrishScottishSeminoleSenegaleseSerbianShoshoneSierra LeoneanSiouxSlavicSlovakSloveneSomaliSouth AfricanSouth AmericanSouth American IndianSoviet UnionSpaniardSpanishSpanish AmericanSpanish American IndianSri LankanSubsaharan AfricanSudaneseSwedishSwissSyrianTaiwaneseThaiTlingit-HaidaTohono O'OdhamTonganTrinidadian and TobagonianTsimshianTurkishU.S. Virgin IslanderUgandanUkrainianUruguayanUteVenezuelanVietnameseWelshWest IndianYakamaYaquiYugoslavianYumanYup'ikZimbabwean
Immigration
NonimmigrantsImmigrantsAfghanistanAfricaAlbaniaArgentinaArmeniaAsiaAustraliaAustriaBahamasBangladeshBarbadosBelarusBelgiumBelizeBoliviaBosnia and HerzegovinaBrazilBulgariaBurma/MyanmarCabo VerdeCambodiaCameroonCanadaCaribbeanCentral AmericaChileChinaColombiaCongoCosta RicaCroatiaCubaCzechoslovakiaDominicaDominican RepublicEastern AfricaEastern AsiaEastern EuropeEcuadorEgyptEl SalvadorEnglandEritreaEthiopiaEuropeFijiFranceGermanyGhanaGreeceGrenadaGuatemalaGuyanaHaitiHondurasHong KongHungaryIndiaIndonesiaIranIraqIrelandIsraelItalyJamaicaJapanJordanKazakhstanKenyaKoreaKuwaitLaosLatin AmericaLatviaLebanonLiberiaLithuaniaMalaysiaMexicoMicronesiaMiddle AfricaMoldovaMoroccoNepalNetherlandsNicaraguaNigeriaNorth AmericaNorth MacedoniaNorthern AfricaNorthern EuropeNorwayOceaniaPakistanPanamaPeruPhilippinesPolandPortugalRomaniaRussiaSaudi ArabiaScotlandSenegalSerbiaSierra LeoneSingaporeSomaliaSouth AfricaSouth AmericaSouth Central AsiaSouth Eastern AsiaSouthern EuropeSpainSri LankaSt. Vincent and the GrenadinesSudanSwedenSwitzerlandSyriaTaiwanThailandTrinidad and TobagoTurkeyUgandaUkraineUruguayUzbekistanVenezuelaVietnamWest IndiesWestern AfricaWestern AsiaWestern EuropeYemenZaireZimbabweAzores
Single Mother Households
Income
Poverty
Unemployment
Labor Participation
Family Structure
Vehicle Availability
Education Level
Disability

Single Mother Households Comparison

Immigrants from Denmark

Basques

Exceptional
Exceptional
5.5%
SINGLE MOTHER HOUSEHOLDS
99.1/ 100
METRIC RATING
55th/ 347
METRIC RANK
5.7%
SINGLE MOTHER HOUSEHOLDS
96.7/ 100
METRIC RATING
94th/ 347
METRIC RANK

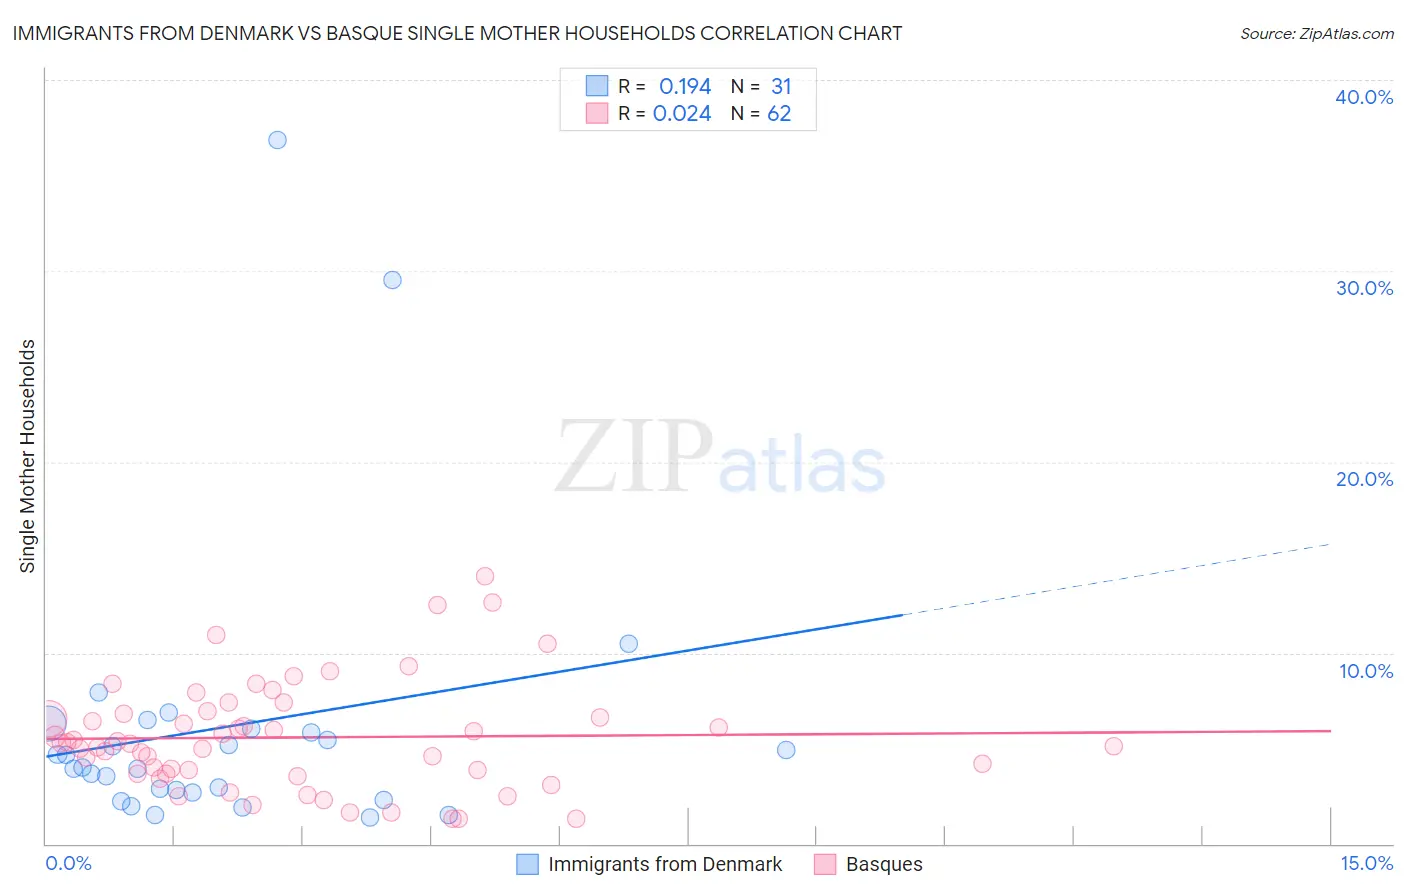
Immigrants from Denmark vs Basque Single Mother Households Correlation Chart

The statistical analysis conducted on geographies consisting of 136,130,833 people shows a poor positive correlation between the proportion of Immigrants from Denmark and percentage of single mother households in the United States with a correlation coefficient (R) of 0.194 and weighted average of 5.5%. Similarly, the statistical analysis conducted on geographies consisting of 165,555,400 people shows no correlation between the proportion of Basques and percentage of single mother households in the United States with a correlation coefficient (R) of 0.024 and weighted average of 5.7%, a difference of 4.0%.
Immigrants from Denmark vs Basque Single Mother Households

Single Mother Households Correlation Summary

MeasurementImmigrants from DenmarkBasque
Minimum1.4%1.3%
Maximum36.9%14.0%
Range35.5%12.7%
Mean6.1%5.6%
Median4.0%5.2%
Interquartile 25% (IQ1)2.7%3.7%
Interquartile 75% (IQ3)6.0%6.8%
Interquartile Range (IQR)3.3%3.1%
Standard Deviation (Sample)7.6%2.8%
Standard Deviation (Population)7.5%2.8%

Similar Demographics by Single Mother Households

Demographics Similar to Immigrants from Denmark by Single Mother Households

In terms of single mother households, the demographic groups most similar to Immigrants from Denmark are Immigrants from Romania (5.5%, a difference of 0.070%), Immigrants from Europe (5.5%, a difference of 0.15%), Immigrants from Lebanon (5.5%, a difference of 0.17%), Immigrants from Russia (5.5%, a difference of 0.19%), and Swedish (5.5%, a difference of 0.29%).
DemographicsRating | RankSingle Mother Households
Turks
99.2
/100
|
#48
Exceptional
5.5%
Immigrants | Latvia
99.2
/100
|
#49
Exceptional
5.5%
Immigrants | Scotland
99.2
/100
|
#50
Exceptional
5.5%
Immigrants | Belarus
99.2
/100
|
#51
Exceptional
5.5%
Swedes
99.1
/100
|
#52
Exceptional
5.5%
Immigrants | Russia
99.1
/100
|
#53
Exceptional
5.5%
Immigrants | Lebanon
99.1
/100
|
#54
Exceptional
5.5%
Immigrants | Denmark
99.1
/100
|
#55
Exceptional
5.5%
Immigrants | Romania
99.0
/100
|
#56
Exceptional
5.5%
Immigrants | Europe
99.0
/100
|
#57
Exceptional
5.5%
Danes
98.9
/100
|
#58
Exceptional
5.5%
Luxembourgers
98.7
/100
|
#59
Exceptional
5.6%
Immigrants | Norway
98.7
/100
|
#60
Exceptional
5.6%
Australians
98.7
/100
|
#61
Exceptional
5.6%
Poles
98.6
/100
|
#62
Exceptional
5.6%

Demographics Similar to Basques by Single Mother Households

In terms of single mother households, the demographic groups most similar to Basques are Serbian (5.7%, a difference of 0.050%), Immigrants from Western Asia (5.7%, a difference of 0.060%), Slovak (5.7%, a difference of 0.060%), Austrian (5.7%, a difference of 0.21%), and Tlingit-Haida (5.7%, a difference of 0.26%).
DemographicsRating | RankSingle Mother Households
Immigrants | Turkey
97.5
/100
|
#87
Exceptional
5.7%
Israelis
97.4
/100
|
#88
Exceptional
5.7%
Ukrainians
97.2
/100
|
#89
Exceptional
5.7%
Immigrants | Indonesia
97.2
/100
|
#90
Exceptional
5.7%
Europeans
97.0
/100
|
#91
Exceptional
5.7%
Immigrants | Western Asia
96.7
/100
|
#92
Exceptional
5.7%
Serbians
96.7
/100
|
#93
Exceptional
5.7%
Basques
96.7
/100
|
#94
Exceptional
5.7%
Slovaks
96.6
/100
|
#95
Exceptional
5.7%
Austrians
96.4
/100
|
#96
Exceptional
5.7%
Tlingit-Haida
96.4
/100
|
#97
Exceptional
5.7%
Immigrants | South Africa
96.3
/100
|
#98
Exceptional
5.7%
Immigrants | Poland
96.3
/100
|
#99
Exceptional
5.8%
Scandinavians
96.2
/100
|
#100
Exceptional
5.8%
Germans
96.2
/100
|
#101
Exceptional
5.8%