Immigrants from Czechoslovakia vs Peruvian Currently Married
COMPARE
Immigrants from Czechoslovakia
Peruvian
Currently Married
Currently Married Comparison
Immigrants from Czechoslovakia
Peruvians
48.4%
CURRENTLY MARRIED
98.3/ 100
METRIC RATING
64th/ 347
METRIC RANK
46.6%
CURRENTLY MARRIED
50.0/ 100
METRIC RATING
174th/ 347
METRIC RANK
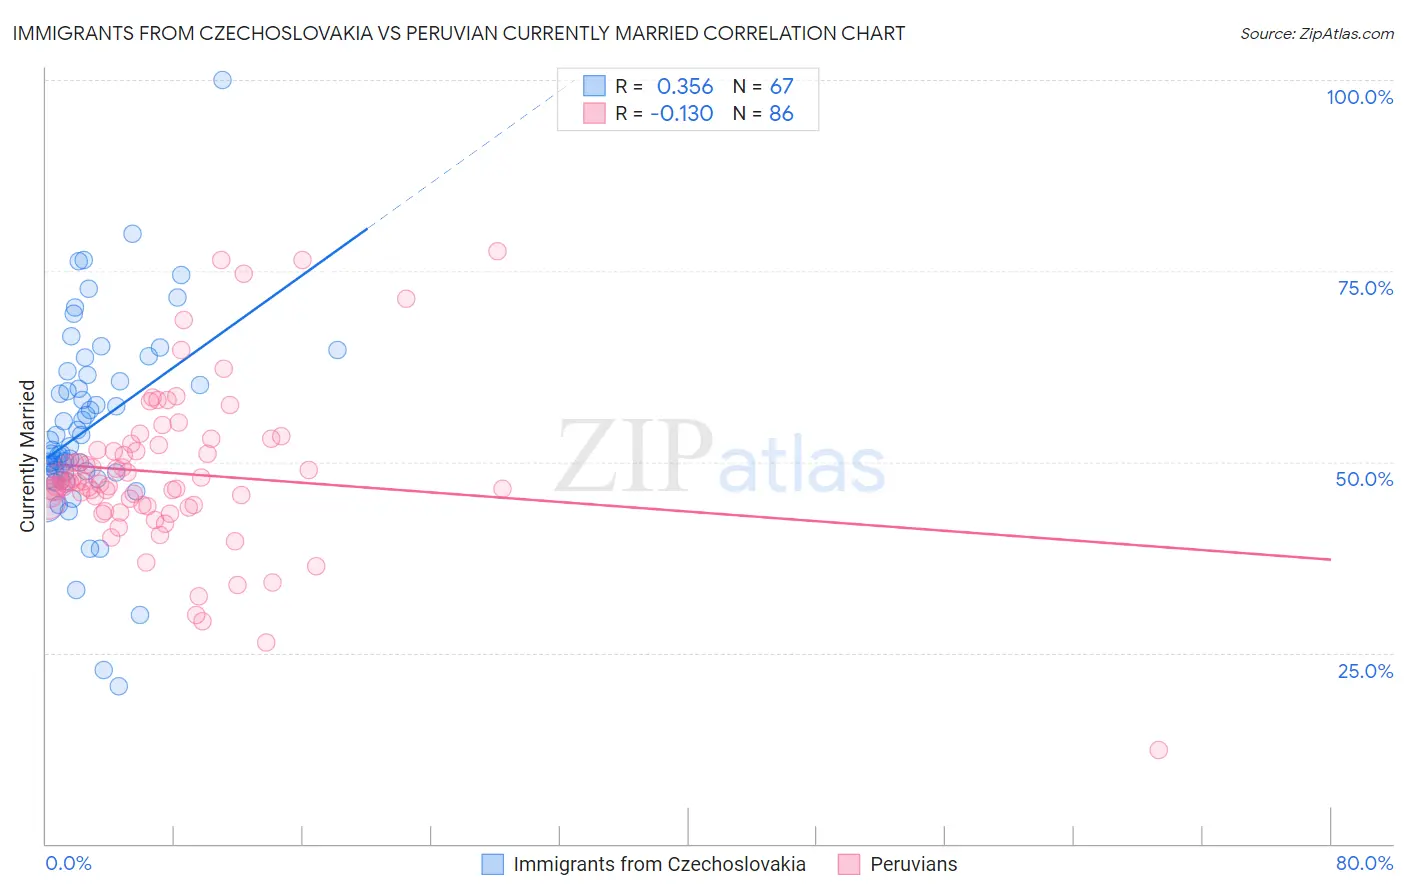
Immigrants from Czechoslovakia vs Peruvian Currently Married Correlation Chart
The statistical analysis conducted on geographies consisting of 195,455,997 people shows a mild positive correlation between the proportion of Immigrants from Czechoslovakia and percentage of population currently married in the United States with a correlation coefficient (R) of 0.356 and weighted average of 48.4%. Similarly, the statistical analysis conducted on geographies consisting of 363,210,546 people shows a poor negative correlation between the proportion of Peruvians and percentage of population currently married in the United States with a correlation coefficient (R) of -0.130 and weighted average of 46.6%, a difference of 3.7%.
Currently Married Correlation Summary
| Measurement | Immigrants from Czechoslovakia | Peruvian |
| Minimum | 20.6% | 12.3% |
| Maximum | 100.0% | 77.5% |
| Range | 79.4% | 65.2% |
| Mean | 54.6% | 48.5% |
| Median | 52.0% | 47.3% |
| Interquartile 25% (IQ1) | 48.5% | 44.3% |
| Interquartile 75% (IQ3) | 61.4% | 52.1% |
| Interquartile Range (IQR) | 12.9% | 7.9% |
| Standard Deviation (Sample) | 12.8% | 10.5% |
| Standard Deviation (Population) | 12.7% | 10.4% |
Similar Demographics by Currently Married
Demographics Similar to Immigrants from Czechoslovakia by Currently Married
In terms of currently married, the demographic groups most similar to Immigrants from Czechoslovakia are Slavic (48.4%, a difference of 0.0%), Ukrainian (48.4%, a difference of 0.010%), Tongan (48.3%, a difference of 0.030%), Slovak (48.3%, a difference of 0.050%), and Immigrants from England (48.3%, a difference of 0.060%).
| Demographics | Rating | Rank | Currently Married |
| Immigrants | Netherlands | 98.6 /100 | #57 | Exceptional 48.5% |
| French | 98.6 /100 | #58 | Exceptional 48.4% |
| Immigrants | Ireland | 98.5 /100 | #59 | Exceptional 48.4% |
| Immigrants | Romania | 98.5 /100 | #60 | Exceptional 48.4% |
| Romanians | 98.5 /100 | #61 | Exceptional 48.4% |
| Asians | 98.5 /100 | #62 | Exceptional 48.4% |
| Slavs | 98.3 /100 | #63 | Exceptional 48.4% |
| Immigrants | Czechoslovakia | 98.3 /100 | #64 | Exceptional 48.4% |
| Ukrainians | 98.3 /100 | #65 | Exceptional 48.4% |
| Tongans | 98.2 /100 | #66 | Exceptional 48.3% |
| Slovaks | 98.2 /100 | #67 | Exceptional 48.3% |
| Immigrants | England | 98.2 /100 | #68 | Exceptional 48.3% |
| Canadians | 98.1 /100 | #69 | Exceptional 48.3% |
| Immigrants | Asia | 97.9 /100 | #70 | Exceptional 48.3% |
| Macedonians | 97.9 /100 | #71 | Exceptional 48.3% |
Demographics Similar to Peruvians by Currently Married
In terms of currently married, the demographic groups most similar to Peruvians are Immigrants from Brazil (46.6%, a difference of 0.010%), Tlingit-Haida (46.7%, a difference of 0.040%), Hawaiian (46.6%, a difference of 0.050%), Israeli (46.6%, a difference of 0.050%), and Aleut (46.7%, a difference of 0.070%).
| Demographics | Rating | Rank | Currently Married |
| Spaniards | 58.8 /100 | #167 | Average 46.8% |
| Immigrants | Afghanistan | 58.2 /100 | #168 | Average 46.8% |
| Armenians | 58.2 /100 | #169 | Average 46.8% |
| Immigrants | Latvia | 56.7 /100 | #170 | Average 46.7% |
| Immigrants | Zimbabwe | 52.4 /100 | #171 | Average 46.7% |
| Aleuts | 52.0 /100 | #172 | Average 46.7% |
| Tlingit-Haida | 51.2 /100 | #173 | Average 46.7% |
| Peruvians | 50.0 /100 | #174 | Average 46.6% |
| Immigrants | Brazil | 49.9 /100 | #175 | Average 46.6% |
| Hawaiians | 48.6 /100 | #176 | Average 46.6% |
| Israelis | 48.6 /100 | #177 | Average 46.6% |
| Chickasaw | 47.8 /100 | #178 | Average 46.6% |
| Immigrants | Oceania | 44.6 /100 | #179 | Average 46.5% |
| Costa Ricans | 43.7 /100 | #180 | Average 46.5% |
| Ottawa | 43.0 /100 | #181 | Average 46.5% |