Immigrants from Czechoslovakia vs Immigrants from Bolivia Married-couple Households
COMPARE
Immigrants from Czechoslovakia
Immigrants from Bolivia
Married-couple Households
Married-couple Households Comparison
Immigrants from Czechoslovakia
Immigrants from Bolivia
47.8%
MARRIED-COUPLE HOUSEHOLDS
95.5/ 100
METRIC RATING
105th/ 347
METRIC RANK
48.9%
MARRIED-COUPLE HOUSEHOLDS
99.6/ 100
METRIC RATING
40th/ 347
METRIC RANK
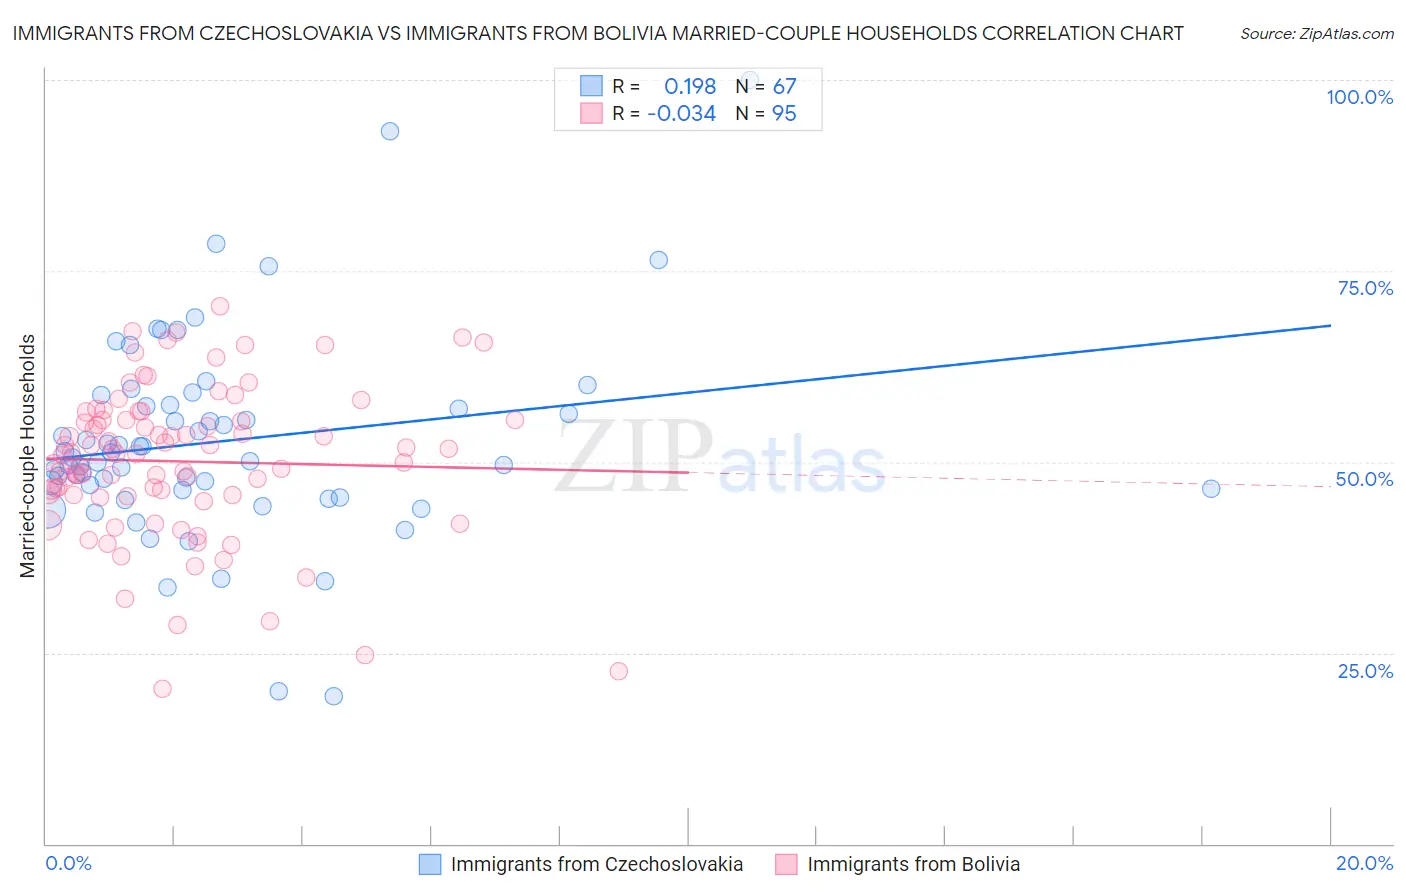
Immigrants from Czechoslovakia vs Immigrants from Bolivia Married-couple Households Correlation Chart
The statistical analysis conducted on geographies consisting of 195,446,712 people shows a poor positive correlation between the proportion of Immigrants from Czechoslovakia and percentage of married-couple family households in the United States with a correlation coefficient (R) of 0.198 and weighted average of 47.8%. Similarly, the statistical analysis conducted on geographies consisting of 158,720,883 people shows no correlation between the proportion of Immigrants from Bolivia and percentage of married-couple family households in the United States with a correlation coefficient (R) of -0.034 and weighted average of 48.9%, a difference of 2.3%.
Married-couple Households Correlation Summary
| Measurement | Immigrants from Czechoslovakia | Immigrants from Bolivia |
| Minimum | 19.3% | 20.3% |
| Maximum | 100.0% | 70.3% |
| Range | 80.7% | 50.0% |
| Mean | 52.7% | 50.1% |
| Median | 50.6% | 51.1% |
| Interquartile 25% (IQ1) | 46.3% | 45.6% |
| Interquartile 75% (IQ3) | 57.4% | 55.5% |
| Interquartile Range (IQR) | 11.1% | 9.9% |
| Standard Deviation (Sample) | 13.4% | 9.9% |
| Standard Deviation (Population) | 13.3% | 9.9% |
Similar Demographics by Married-couple Households
Demographics Similar to Immigrants from Czechoslovakia by Married-couple Households
In terms of married-couple households, the demographic groups most similar to Immigrants from Czechoslovakia are Portuguese (47.8%, a difference of 0.010%), Immigrants from South Africa (47.8%, a difference of 0.10%), Slavic (47.8%, a difference of 0.11%), Hawaiian (47.8%, a difference of 0.11%), and Turkish (47.8%, a difference of 0.13%).
| Demographics | Rating | Rank | Married-couple Households |
| Immigrants | North Macedonia | 96.4 /100 | #98 | Exceptional 47.9% |
| Immigrants | Austria | 96.4 /100 | #99 | Exceptional 47.9% |
| Immigrants | Italy | 96.3 /100 | #100 | Exceptional 47.9% |
| Turks | 96.1 /100 | #101 | Exceptional 47.8% |
| Slavs | 96.0 /100 | #102 | Exceptional 47.8% |
| Hawaiians | 96.0 /100 | #103 | Exceptional 47.8% |
| Immigrants | South Africa | 96.0 /100 | #104 | Exceptional 47.8% |
| Immigrants | Czechoslovakia | 95.5 /100 | #105 | Exceptional 47.8% |
| Portuguese | 95.5 /100 | #106 | Exceptional 47.8% |
| Estonians | 94.7 /100 | #107 | Exceptional 47.7% |
| Immigrants | Japan | 94.4 /100 | #108 | Exceptional 47.7% |
| Immigrants | Jordan | 94.1 /100 | #109 | Exceptional 47.7% |
| Macedonians | 93.9 /100 | #110 | Exceptional 47.6% |
| Syrians | 93.9 /100 | #111 | Exceptional 47.6% |
| Peruvians | 93.8 /100 | #112 | Exceptional 47.6% |
Demographics Similar to Immigrants from Bolivia by Married-couple Households
In terms of married-couple households, the demographic groups most similar to Immigrants from Bolivia are Lithuanian (48.9%, a difference of 0.010%), Immigrants from Lebanon (48.9%, a difference of 0.030%), Immigrants from Vietnam (48.8%, a difference of 0.080%), Greek (48.9%, a difference of 0.10%), and Immigrants from Iran (48.8%, a difference of 0.14%).
| Demographics | Rating | Rank | Married-couple Households |
| Immigrants | Asia | 99.7 /100 | #33 | Exceptional 49.1% |
| Italians | 99.7 /100 | #34 | Exceptional 49.0% |
| Scottish | 99.7 /100 | #35 | Exceptional 49.0% |
| Iranians | 99.7 /100 | #36 | Exceptional 49.0% |
| Sri Lankans | 99.7 /100 | #37 | Exceptional 49.0% |
| Greeks | 99.7 /100 | #38 | Exceptional 48.9% |
| Lithuanians | 99.6 /100 | #39 | Exceptional 48.9% |
| Immigrants | Bolivia | 99.6 /100 | #40 | Exceptional 48.9% |
| Immigrants | Lebanon | 99.6 /100 | #41 | Exceptional 48.9% |
| Immigrants | Vietnam | 99.6 /100 | #42 | Exceptional 48.8% |
| Immigrants | Iran | 99.6 /100 | #43 | Exceptional 48.8% |
| Welsh | 99.5 /100 | #44 | Exceptional 48.8% |
| Immigrants | Eastern Asia | 99.5 /100 | #45 | Exceptional 48.8% |
| Tsimshian | 99.5 /100 | #46 | Exceptional 48.7% |
| British | 99.5 /100 | #47 | Exceptional 48.7% |