Swiss vs Welsh Currently Married
COMPARE
Swiss
Welsh
Currently Married
Currently Married Comparison
Swiss
Welsh
49.7%
CURRENTLY MARRIED
99.9/ 100
METRIC RATING
12th/ 347
METRIC RANK
48.9%
CURRENTLY MARRIED
99.5/ 100
METRIC RATING
28th/ 347
METRIC RANK
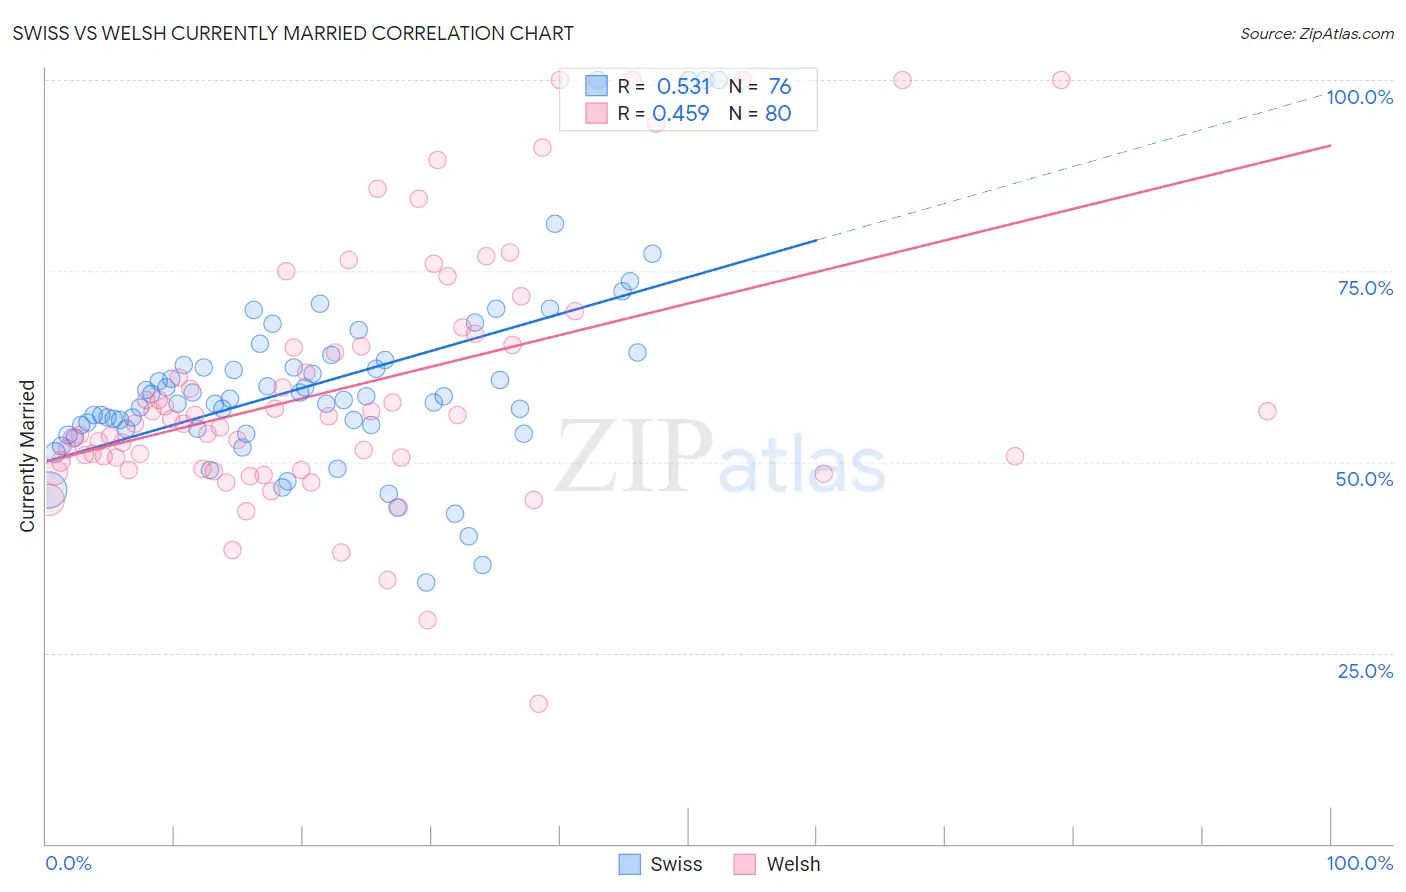
Swiss vs Welsh Currently Married Correlation Chart
The statistical analysis conducted on geographies consisting of 464,962,808 people shows a substantial positive correlation between the proportion of Swiss and percentage of population currently married in the United States with a correlation coefficient (R) of 0.531 and weighted average of 49.7%. Similarly, the statistical analysis conducted on geographies consisting of 528,516,985 people shows a moderate positive correlation between the proportion of Welsh and percentage of population currently married in the United States with a correlation coefficient (R) of 0.459 and weighted average of 48.9%, a difference of 1.6%.
Currently Married Correlation Summary
| Measurement | Swiss | Welsh |
| Minimum | 34.3% | 18.4% |
| Maximum | 100.0% | 100.0% |
| Range | 65.7% | 81.6% |
| Mean | 60.1% | 59.7% |
| Median | 58.2% | 55.4% |
| Interquartile 25% (IQ1) | 54.3% | 49.6% |
| Interquartile 75% (IQ3) | 63.1% | 66.0% |
| Interquartile Range (IQR) | 8.8% | 16.4% |
| Standard Deviation (Sample) | 12.7% | 16.8% |
| Standard Deviation (Population) | 12.6% | 16.7% |
Demographics Similar to Swiss and Welsh by Currently Married
In terms of currently married, the demographic groups most similar to Swiss are English (49.7%, a difference of 0.0%), Filipino (49.7%, a difference of 0.020%), Dutch (49.6%, a difference of 0.26%), German (49.6%, a difference of 0.28%), and Pennsylvania German (49.6%, a difference of 0.30%). Similarly, the demographic groups most similar to Welsh are Burmese (48.9%, a difference of 0.040%), Croatian (48.9%, a difference of 0.050%), Eastern European (48.9%, a difference of 0.060%), Immigrants from Korea (49.0%, a difference of 0.11%), and Maltese (49.0%, a difference of 0.16%).
| Demographics | Rating | Rank | Currently Married |
| Filipinos | 99.9 /100 | #10 | Exceptional 49.7% |
| English | 99.9 /100 | #11 | Exceptional 49.7% |
| Swiss | 99.9 /100 | #12 | Exceptional 49.7% |
| Dutch | 99.9 /100 | #13 | Exceptional 49.6% |
| Germans | 99.9 /100 | #14 | Exceptional 49.6% |
| Pennsylvania Germans | 99.9 /100 | #15 | Exceptional 49.6% |
| Chinese | 99.9 /100 | #16 | Exceptional 49.5% |
| Scandinavians | 99.9 /100 | #17 | Exceptional 49.5% |
| Immigrants | Scotland | 99.8 /100 | #18 | Exceptional 49.3% |
| Europeans | 99.8 /100 | #19 | Exceptional 49.3% |
| Luxembourgers | 99.8 /100 | #20 | Exceptional 49.3% |
| Scottish | 99.8 /100 | #21 | Exceptional 49.2% |
| Bulgarians | 99.7 /100 | #22 | Exceptional 49.1% |
| Immigrants | Pakistan | 99.7 /100 | #23 | Exceptional 49.1% |
| Lithuanians | 99.6 /100 | #24 | Exceptional 49.0% |
| Maltese | 99.6 /100 | #25 | Exceptional 49.0% |
| Immigrants | Korea | 99.6 /100 | #26 | Exceptional 49.0% |
| Burmese | 99.6 /100 | #27 | Exceptional 48.9% |
| Welsh | 99.5 /100 | #28 | Exceptional 48.9% |
| Croatians | 99.5 /100 | #29 | Exceptional 48.9% |
| Eastern Europeans | 99.5 /100 | #30 | Exceptional 48.9% |