Immigrants from Croatia vs Immigrants from Nepal Divorced or Separated
COMPARE
Immigrants from Croatia
Immigrants from Nepal
Divorced or Separated
Divorced or Separated Comparison
Immigrants from Croatia
Immigrants from Nepal
11.6%
DIVORCED OR SEPARATED
98.3/ 100
METRIC RATING
102nd/ 347
METRIC RANK
11.6%
DIVORCED OR SEPARATED
99.2/ 100
METRIC RATING
87th/ 347
METRIC RANK
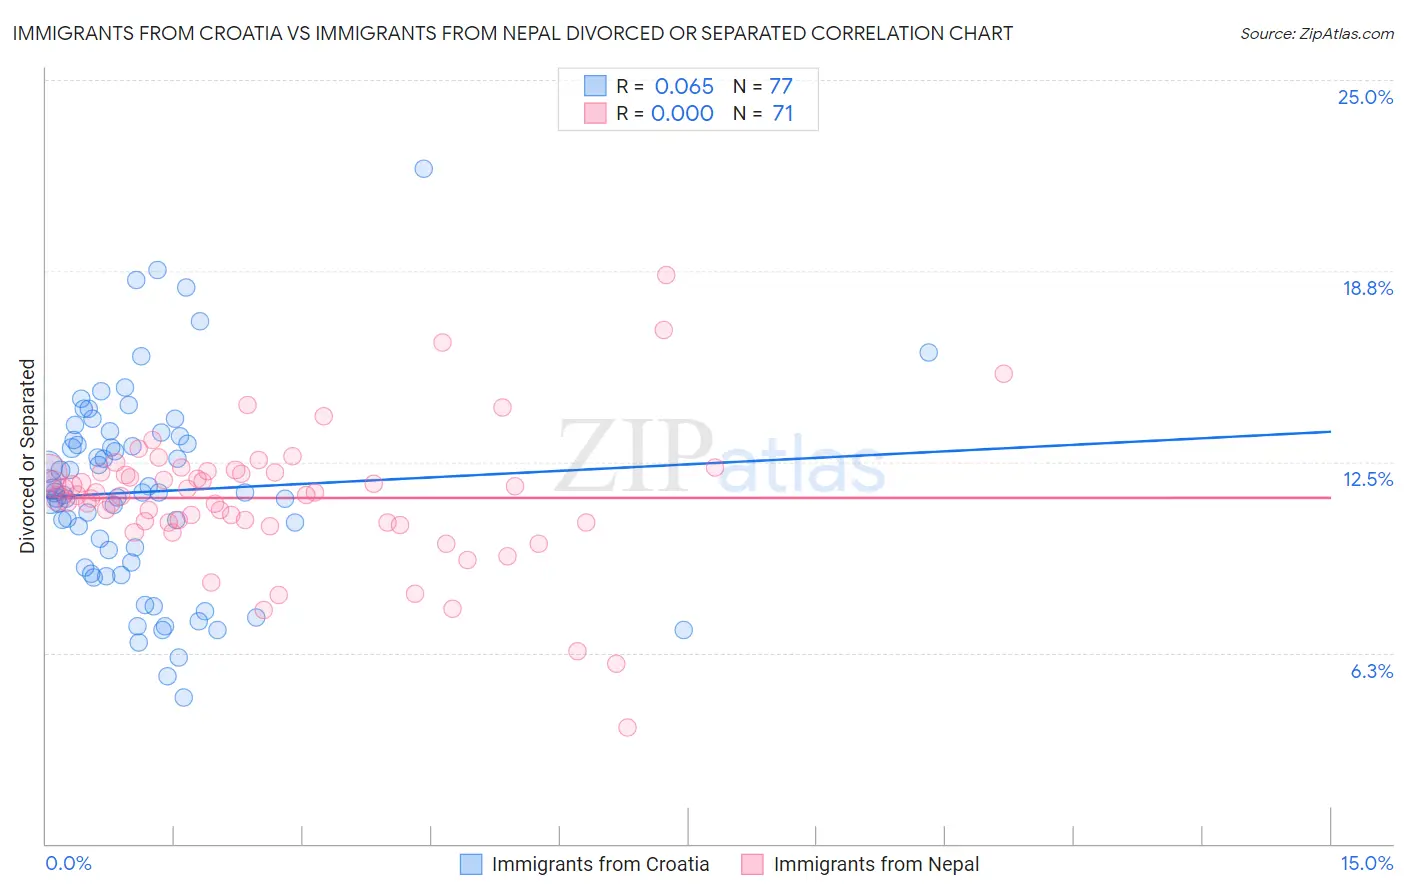
Immigrants from Croatia vs Immigrants from Nepal Divorced or Separated Correlation Chart
The statistical analysis conducted on geographies consisting of 132,566,764 people shows a slight positive correlation between the proportion of Immigrants from Croatia and percentage of population currently divorced or separated in the United States with a correlation coefficient (R) of 0.065 and weighted average of 11.6%. Similarly, the statistical analysis conducted on geographies consisting of 186,713,204 people shows no correlation between the proportion of Immigrants from Nepal and percentage of population currently divorced or separated in the United States with a correlation coefficient (R) of 0.000 and weighted average of 11.6%, a difference of 0.69%.
Divorced or Separated Correlation Summary
| Measurement | Immigrants from Croatia | Immigrants from Nepal |
| Minimum | 4.8% | 3.8% |
| Maximum | 22.1% | 18.6% |
| Range | 17.3% | 14.8% |
| Mean | 11.5% | 11.3% |
| Median | 11.5% | 11.4% |
| Interquartile 25% (IQ1) | 9.1% | 10.5% |
| Interquartile 75% (IQ3) | 13.3% | 12.2% |
| Interquartile Range (IQR) | 4.1% | 1.7% |
| Standard Deviation (Sample) | 3.3% | 2.3% |
| Standard Deviation (Population) | 3.2% | 2.3% |
Demographics Similar to Immigrants from Croatia and Immigrants from Nepal by Divorced or Separated
In terms of divorced or separated, the demographic groups most similar to Immigrants from Croatia are Maltese (11.6%, a difference of 0.040%), Salvadoran (11.6%, a difference of 0.050%), Immigrants from Guyana (11.6%, a difference of 0.14%), Immigrants from Northern Europe (11.6%, a difference of 0.17%), and Immigrants from Sweden (11.6%, a difference of 0.21%). Similarly, the demographic groups most similar to Immigrants from Nepal are Immigrants from Latvia (11.6%, a difference of 0.030%), Immigrants from Europe (11.6%, a difference of 0.030%), Immigrants from Southern Europe (11.6%, a difference of 0.070%), Immigrants from Albania (11.5%, a difference of 0.10%), and Bulgarian (11.5%, a difference of 0.15%).
| Demographics | Rating | Rank | Divorced or Separated |
| Bulgarians | 99.3 /100 | #84 | Exceptional 11.5% |
| Immigrants | Albania | 99.3 /100 | #85 | Exceptional 11.5% |
| Immigrants | Latvia | 99.2 /100 | #86 | Exceptional 11.6% |
| Immigrants | Nepal | 99.2 /100 | #87 | Exceptional 11.6% |
| Immigrants | Europe | 99.2 /100 | #88 | Exceptional 11.6% |
| Immigrants | Southern Europe | 99.1 /100 | #89 | Exceptional 11.6% |
| Zimbabweans | 99.0 /100 | #90 | Exceptional 11.6% |
| Spanish American Indians | 99.0 /100 | #91 | Exceptional 11.6% |
| Immigrants | Denmark | 98.9 /100 | #92 | Exceptional 11.6% |
| Arabs | 98.9 /100 | #93 | Exceptional 11.6% |
| Immigrants | Fiji | 98.9 /100 | #94 | Exceptional 11.6% |
| Immigrants | Serbia | 98.8 /100 | #95 | Exceptional 11.6% |
| Immigrants | Ukraine | 98.7 /100 | #96 | Exceptional 11.6% |
| Latvians | 98.7 /100 | #97 | Exceptional 11.6% |
| Immigrants | Jordan | 98.6 /100 | #98 | Exceptional 11.6% |
| Immigrants | Sweden | 98.6 /100 | #99 | Exceptional 11.6% |
| Immigrants | Northern Europe | 98.6 /100 | #100 | Exceptional 11.6% |
| Immigrants | Guyana | 98.5 /100 | #101 | Exceptional 11.6% |
| Immigrants | Croatia | 98.3 /100 | #102 | Exceptional 11.6% |
| Maltese | 98.2 /100 | #103 | Exceptional 11.6% |
| Salvadorans | 98.2 /100 | #104 | Exceptional 11.6% |