Immigrants from Congo vs Norwegian Single Mother Households
COMPARE
Immigrants from Congo
Norwegian
Single Mother Households
Single Mother Households Comparison
Immigrants from Congo
Norwegians
8.1%
SINGLE MOTHER HOUSEHOLDS
0.0/ 100
METRIC RATING
311th/ 347
METRIC RANK
5.5%
SINGLE MOTHER HOUSEHOLDS
99.3/ 100
METRIC RATING
47th/ 347
METRIC RANK
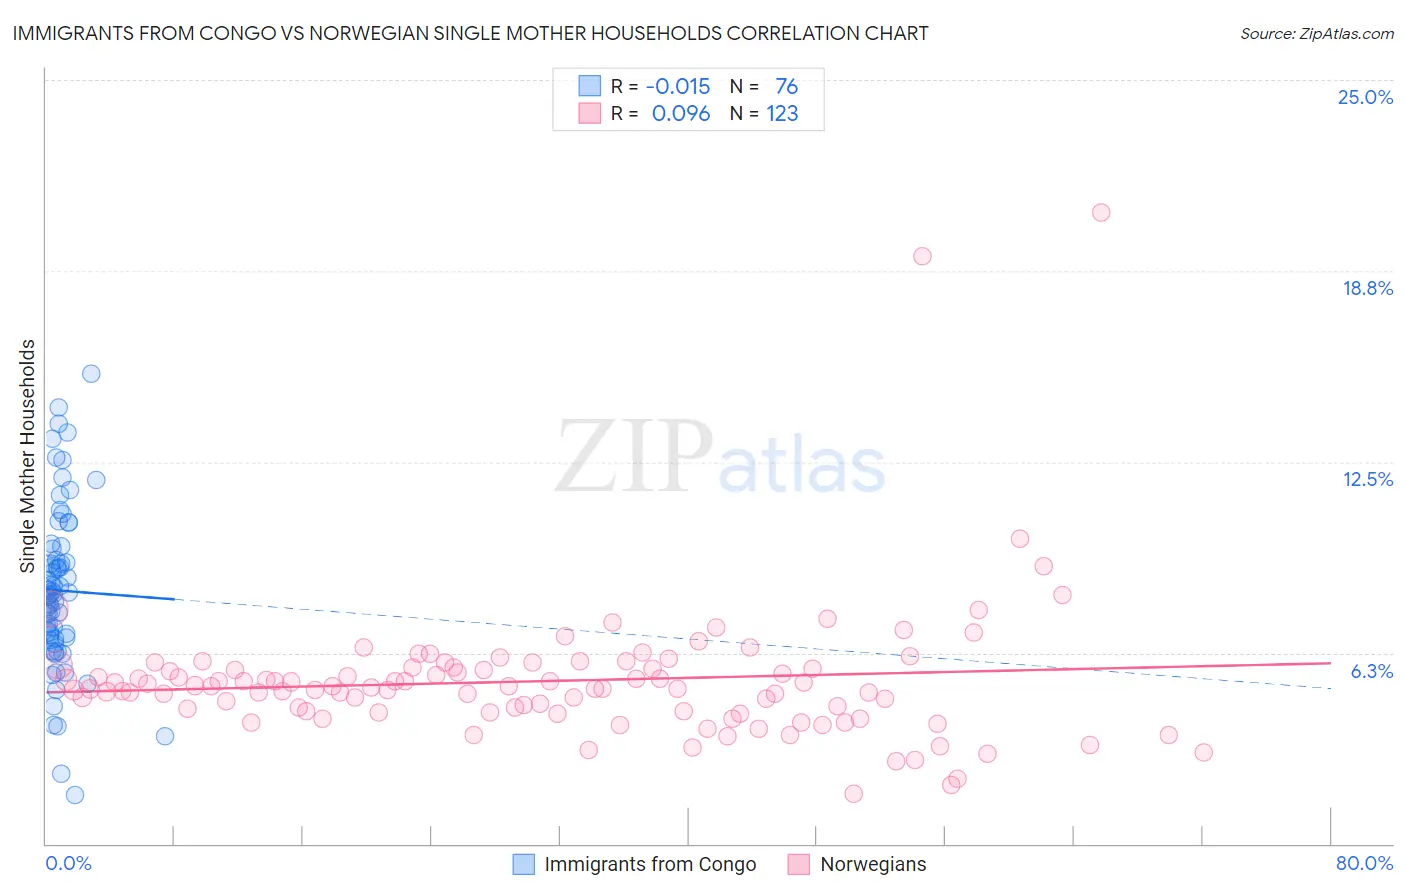
Immigrants from Congo vs Norwegian Single Mother Households Correlation Chart
The statistical analysis conducted on geographies consisting of 92,069,914 people shows no correlation between the proportion of Immigrants from Congo and percentage of single mother households in the United States with a correlation coefficient (R) of -0.015 and weighted average of 8.1%. Similarly, the statistical analysis conducted on geographies consisting of 529,367,930 people shows a slight positive correlation between the proportion of Norwegians and percentage of single mother households in the United States with a correlation coefficient (R) of 0.096 and weighted average of 5.5%, a difference of 48.5%.
Single Mother Households Correlation Summary
| Measurement | Immigrants from Congo | Norwegian |
| Minimum | 1.6% | 1.6% |
| Maximum | 15.4% | 20.7% |
| Range | 13.8% | 19.0% |
| Mean | 8.3% | 5.3% |
| Median | 8.2% | 5.1% |
| Interquartile 25% (IQ1) | 6.7% | 4.3% |
| Interquartile 75% (IQ3) | 9.5% | 5.8% |
| Interquartile Range (IQR) | 2.7% | 1.4% |
| Standard Deviation (Sample) | 2.7% | 2.3% |
| Standard Deviation (Population) | 2.7% | 2.3% |
Similar Demographics by Single Mother Households
Demographics Similar to Immigrants from Congo by Single Mother Households
In terms of single mother households, the demographic groups most similar to Immigrants from Congo are Honduran (8.1%, a difference of 0.29%), Bangladeshi (8.1%, a difference of 0.29%), Cheyenne (8.1%, a difference of 0.35%), Immigrants from Grenada (8.2%, a difference of 0.45%), and Immigrants from Mexico (8.2%, a difference of 0.57%).
| Demographics | Rating | Rank | Single Mother Households |
| Natives/Alaskans | 0.0 /100 | #304 | Tragic 8.0% |
| Colville | 0.0 /100 | #305 | Tragic 8.0% |
| Immigrants | Barbados | 0.0 /100 | #306 | Tragic 8.0% |
| Immigrants | St. Vincent and the Grenadines | 0.0 /100 | #307 | Tragic 8.0% |
| Immigrants | Central America | 0.0 /100 | #308 | Tragic 8.1% |
| Cheyenne | 0.0 /100 | #309 | Tragic 8.1% |
| Hondurans | 0.0 /100 | #310 | Tragic 8.1% |
| Immigrants | Congo | 0.0 /100 | #311 | Tragic 8.1% |
| Bangladeshis | 0.0 /100 | #312 | Tragic 8.1% |
| Immigrants | Grenada | 0.0 /100 | #313 | Tragic 8.2% |
| Immigrants | Mexico | 0.0 /100 | #314 | Tragic 8.2% |
| Immigrants | Western Africa | 0.0 /100 | #315 | Tragic 8.2% |
| Africans | 0.0 /100 | #316 | Tragic 8.2% |
| Immigrants | Honduras | 0.0 /100 | #317 | Tragic 8.2% |
| Senegalese | 0.0 /100 | #318 | Tragic 8.2% |
Demographics Similar to Norwegians by Single Mother Households
In terms of single mother households, the demographic groups most similar to Norwegians are Croatian (5.5%, a difference of 0.18%), Turkish (5.5%, a difference of 0.20%), Immigrants from Latvia (5.5%, a difference of 0.23%), Immigrants from Scotland (5.5%, a difference of 0.42%), and Immigrants from Croatia (5.4%, a difference of 0.44%).
| Demographics | Rating | Rank | Single Mother Households |
| Estonians | 99.6 /100 | #40 | Exceptional 5.4% |
| Immigrants | Greece | 99.5 /100 | #41 | Exceptional 5.4% |
| Macedonians | 99.5 /100 | #42 | Exceptional 5.4% |
| Immigrants | South Central Asia | 99.5 /100 | #43 | Exceptional 5.4% |
| Lithuanians | 99.4 /100 | #44 | Exceptional 5.4% |
| Immigrants | Croatia | 99.4 /100 | #45 | Exceptional 5.4% |
| Croatians | 99.3 /100 | #46 | Exceptional 5.5% |
| Norwegians | 99.3 /100 | #47 | Exceptional 5.5% |
| Turks | 99.2 /100 | #48 | Exceptional 5.5% |
| Immigrants | Latvia | 99.2 /100 | #49 | Exceptional 5.5% |
| Immigrants | Scotland | 99.2 /100 | #50 | Exceptional 5.5% |
| Immigrants | Belarus | 99.2 /100 | #51 | Exceptional 5.5% |
| Swedes | 99.1 /100 | #52 | Exceptional 5.5% |
| Immigrants | Russia | 99.1 /100 | #53 | Exceptional 5.5% |
| Immigrants | Lebanon | 99.1 /100 | #54 | Exceptional 5.5% |