Hispanic or Latino vs Immigrants from Southern Europe Single Mother Households
COMPARE
Hispanic or Latino
Immigrants from Southern Europe
Single Mother Households
Single Mother Households Comparison
Hispanics or Latinos
Immigrants from Southern Europe
7.9%
SINGLE MOTHER HOUSEHOLDS
0.0/ 100
METRIC RATING
297th/ 347
METRIC RANK
6.1%
SINGLE MOTHER HOUSEHOLDS
80.5/ 100
METRIC RATING
151st/ 347
METRIC RANK
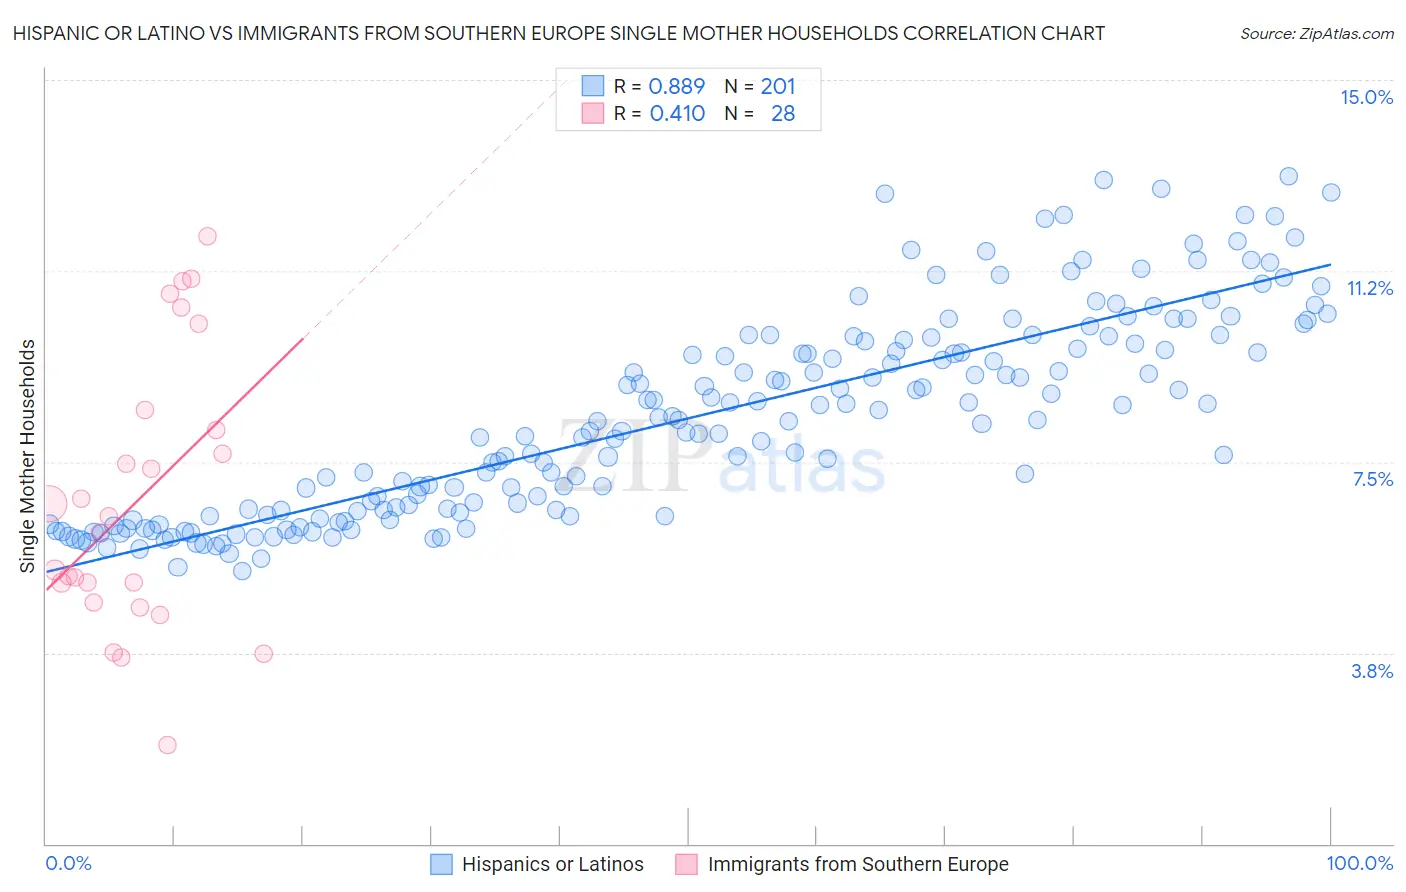
Hispanic or Latino vs Immigrants from Southern Europe Single Mother Households Correlation Chart
The statistical analysis conducted on geographies consisting of 572,818,601 people shows a very strong positive correlation between the proportion of Hispanics or Latinos and percentage of single mother households in the United States with a correlation coefficient (R) of 0.889 and weighted average of 7.9%. Similarly, the statistical analysis conducted on geographies consisting of 401,370,975 people shows a moderate positive correlation between the proportion of Immigrants from Southern Europe and percentage of single mother households in the United States with a correlation coefficient (R) of 0.410 and weighted average of 6.1%, a difference of 30.4%.
Single Mother Households Correlation Summary
| Measurement | Hispanic or Latino | Immigrants from Southern Europe |
| Minimum | 5.4% | 1.9% |
| Maximum | 13.1% | 11.9% |
| Range | 7.8% | 10.0% |
| Mean | 8.4% | 6.7% |
| Median | 8.3% | 6.3% |
| Interquartile 25% (IQ1) | 6.5% | 4.9% |
| Interquartile 75% (IQ3) | 9.8% | 8.3% |
| Interquartile Range (IQR) | 3.4% | 3.4% |
| Standard Deviation (Sample) | 2.0% | 2.7% |
| Standard Deviation (Population) | 2.0% | 2.6% |
Similar Demographics by Single Mother Households
Demographics Similar to Hispanics or Latinos by Single Mother Households
In terms of single mother households, the demographic groups most similar to Hispanics or Latinos are Immigrants from Latin America (7.9%, a difference of 0.040%), Barbadian (7.9%, a difference of 0.10%), Immigrants from West Indies (7.9%, a difference of 0.11%), Houma (7.9%, a difference of 0.19%), and Apache (7.9%, a difference of 0.39%).
| Demographics | Rating | Rank | Single Mother Households |
| Immigrants | Nigeria | 0.0 /100 | #290 | Tragic 7.8% |
| West Indians | 0.0 /100 | #291 | Tragic 7.8% |
| Ghanaians | 0.0 /100 | #292 | Tragic 7.8% |
| Immigrants | Cameroon | 0.0 /100 | #293 | Tragic 7.9% |
| Apache | 0.0 /100 | #294 | Tragic 7.9% |
| Barbadians | 0.0 /100 | #295 | Tragic 7.9% |
| Immigrants | Latin America | 0.0 /100 | #296 | Tragic 7.9% |
| Hispanics or Latinos | 0.0 /100 | #297 | Tragic 7.9% |
| Immigrants | West Indies | 0.0 /100 | #298 | Tragic 7.9% |
| Houma | 0.0 /100 | #299 | Tragic 7.9% |
| Mexicans | 0.0 /100 | #300 | Tragic 8.0% |
| Chippewa | 0.0 /100 | #301 | Tragic 8.0% |
| Immigrants | Ghana | 0.0 /100 | #302 | Tragic 8.0% |
| Immigrants | Bahamas | 0.0 /100 | #303 | Tragic 8.0% |
| Natives/Alaskans | 0.0 /100 | #304 | Tragic 8.0% |
Demographics Similar to Immigrants from Southern Europe by Single Mother Households
In terms of single mother households, the demographic groups most similar to Immigrants from Southern Europe are Zimbabwean (6.1%, a difference of 0.050%), Immigrants from Albania (6.1%, a difference of 0.19%), Pakistani (6.1%, a difference of 0.23%), Immigrants from Brazil (6.1%, a difference of 0.27%), and Scotch-Irish (6.0%, a difference of 0.30%).
| Demographics | Rating | Rank | Single Mother Households |
| Koreans | 84.4 /100 | #144 | Excellent 6.0% |
| Arabs | 84.0 /100 | #145 | Excellent 6.0% |
| French Canadians | 82.6 /100 | #146 | Excellent 6.0% |
| Immigrants | Jordan | 82.3 /100 | #147 | Excellent 6.0% |
| Scotch-Irish | 82.0 /100 | #148 | Excellent 6.0% |
| Immigrants | Albania | 81.5 /100 | #149 | Excellent 6.1% |
| Zimbabweans | 80.7 /100 | #150 | Excellent 6.1% |
| Immigrants | Southern Europe | 80.5 /100 | #151 | Excellent 6.1% |
| Pakistanis | 79.2 /100 | #152 | Good 6.1% |
| Immigrants | Brazil | 78.9 /100 | #153 | Good 6.1% |
| Immigrants | Philippines | 78.5 /100 | #154 | Good 6.1% |
| Whites/Caucasians | 76.5 /100 | #155 | Good 6.1% |
| Native Hawaiians | 75.0 /100 | #156 | Good 6.1% |
| Chileans | 74.2 /100 | #157 | Good 6.1% |
| Celtics | 73.3 /100 | #158 | Good 6.1% |