Bulgarian vs Immigrants from Southern Europe Single Mother Households
COMPARE
Bulgarian
Immigrants from Southern Europe
Single Mother Households
Single Mother Households Comparison
Bulgarians
Immigrants from Southern Europe
5.3%
SINGLE MOTHER HOUSEHOLDS
99.7/ 100
METRIC RATING
34th/ 347
METRIC RANK
6.1%
SINGLE MOTHER HOUSEHOLDS
80.5/ 100
METRIC RATING
151st/ 347
METRIC RANK
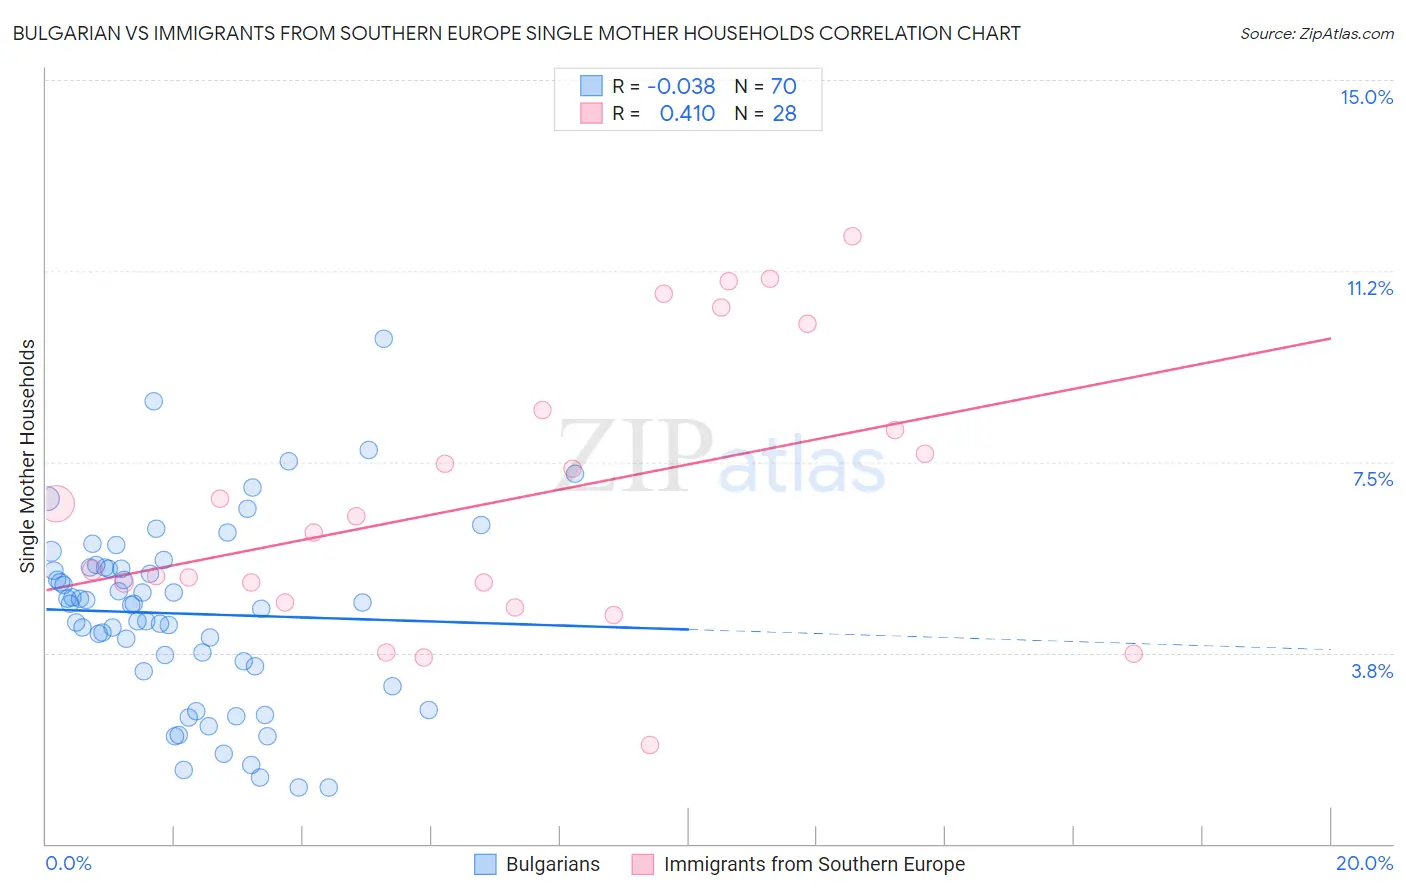
Bulgarian vs Immigrants from Southern Europe Single Mother Households Correlation Chart
The statistical analysis conducted on geographies consisting of 205,286,227 people shows no correlation between the proportion of Bulgarians and percentage of single mother households in the United States with a correlation coefficient (R) of -0.038 and weighted average of 5.3%. Similarly, the statistical analysis conducted on geographies consisting of 401,370,975 people shows a moderate positive correlation between the proportion of Immigrants from Southern Europe and percentage of single mother households in the United States with a correlation coefficient (R) of 0.410 and weighted average of 6.1%, a difference of 14.3%.
Single Mother Households Correlation Summary
| Measurement | Bulgarian | Immigrants from Southern Europe |
| Minimum | 1.1% | 1.9% |
| Maximum | 9.9% | 11.9% |
| Range | 8.8% | 10.0% |
| Mean | 4.5% | 6.7% |
| Median | 4.7% | 6.3% |
| Interquartile 25% (IQ1) | 3.5% | 4.9% |
| Interquartile 75% (IQ3) | 5.4% | 8.3% |
| Interquartile Range (IQR) | 1.9% | 3.4% |
| Standard Deviation (Sample) | 1.8% | 2.7% |
| Standard Deviation (Population) | 1.8% | 2.6% |
Similar Demographics by Single Mother Households
Demographics Similar to Bulgarians by Single Mother Households
In terms of single mother households, the demographic groups most similar to Bulgarians are Immigrants from Switzerland (5.3%, a difference of 0.020%), Immigrants from Northern Europe (5.3%, a difference of 0.040%), Immigrants from Czechoslovakia (5.3%, a difference of 0.24%), Immigrants from Belgium (5.3%, a difference of 0.38%), and Immigrants from Korea (5.3%, a difference of 0.41%).
| Demographics | Rating | Rank | Single Mother Households |
| Bhutanese | 99.7 /100 | #27 | Exceptional 5.3% |
| Russians | 99.7 /100 | #28 | Exceptional 5.3% |
| Latvians | 99.7 /100 | #29 | Exceptional 5.3% |
| Burmese | 99.7 /100 | #30 | Exceptional 5.3% |
| Immigrants | Korea | 99.7 /100 | #31 | Exceptional 5.3% |
| Cambodians | 99.7 /100 | #32 | Exceptional 5.3% |
| Immigrants | Switzerland | 99.7 /100 | #33 | Exceptional 5.3% |
| Bulgarians | 99.7 /100 | #34 | Exceptional 5.3% |
| Immigrants | Northern Europe | 99.7 /100 | #35 | Exceptional 5.3% |
| Immigrants | Czechoslovakia | 99.7 /100 | #36 | Exceptional 5.3% |
| Immigrants | Belgium | 99.7 /100 | #37 | Exceptional 5.3% |
| Immigrants | Serbia | 99.6 /100 | #38 | Exceptional 5.4% |
| Immigrants | Sweden | 99.6 /100 | #39 | Exceptional 5.4% |
| Estonians | 99.6 /100 | #40 | Exceptional 5.4% |
| Immigrants | Greece | 99.5 /100 | #41 | Exceptional 5.4% |
Demographics Similar to Immigrants from Southern Europe by Single Mother Households
In terms of single mother households, the demographic groups most similar to Immigrants from Southern Europe are Zimbabwean (6.1%, a difference of 0.050%), Immigrants from Albania (6.1%, a difference of 0.19%), Pakistani (6.1%, a difference of 0.23%), Immigrants from Brazil (6.1%, a difference of 0.27%), and Scotch-Irish (6.0%, a difference of 0.30%).
| Demographics | Rating | Rank | Single Mother Households |
| Koreans | 84.4 /100 | #144 | Excellent 6.0% |
| Arabs | 84.0 /100 | #145 | Excellent 6.0% |
| French Canadians | 82.6 /100 | #146 | Excellent 6.0% |
| Immigrants | Jordan | 82.3 /100 | #147 | Excellent 6.0% |
| Scotch-Irish | 82.0 /100 | #148 | Excellent 6.0% |
| Immigrants | Albania | 81.5 /100 | #149 | Excellent 6.1% |
| Zimbabweans | 80.7 /100 | #150 | Excellent 6.1% |
| Immigrants | Southern Europe | 80.5 /100 | #151 | Excellent 6.1% |
| Pakistanis | 79.2 /100 | #152 | Good 6.1% |
| Immigrants | Brazil | 78.9 /100 | #153 | Good 6.1% |
| Immigrants | Philippines | 78.5 /100 | #154 | Good 6.1% |
| Whites/Caucasians | 76.5 /100 | #155 | Good 6.1% |
| Native Hawaiians | 75.0 /100 | #156 | Good 6.1% |
| Chileans | 74.2 /100 | #157 | Good 6.1% |
| Celtics | 73.3 /100 | #158 | Good 6.1% |