Soviet Union vs German Single Father Households
COMPARE
Soviet Union
German
Single Father Households
Single Father Households Comparison
Soviet Union
Germans
1.8%
SINGLE FATHER HOUSEHOLDS
100.0/ 100
METRIC RATING
1st/ 347
METRIC RANK
2.4%
SINGLE FATHER HOUSEHOLDS
28.0/ 100
METRIC RATING
197th/ 347
METRIC RANK
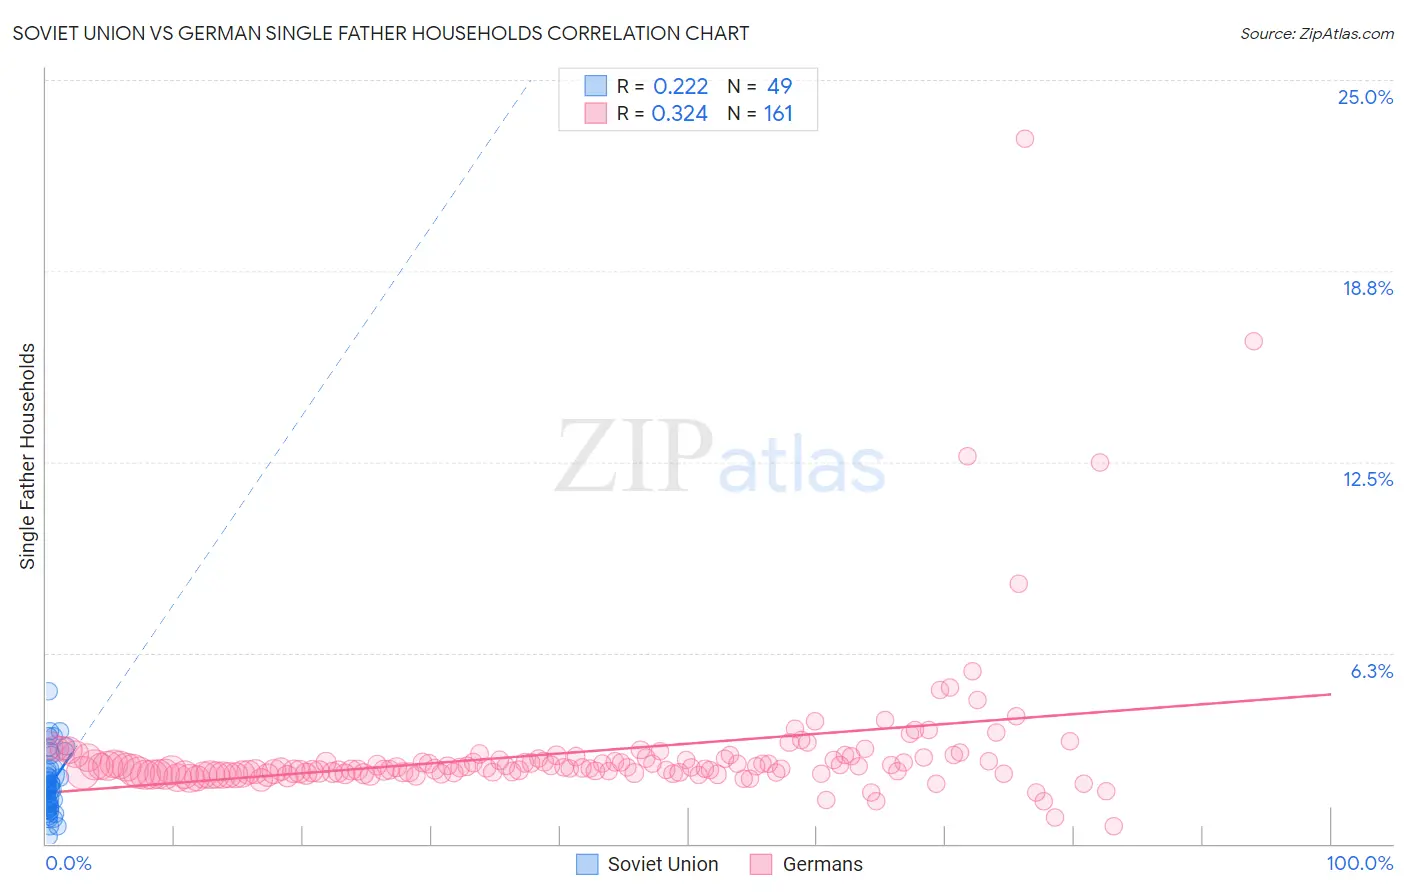
Soviet Union vs German Single Father Households Correlation Chart
The statistical analysis conducted on geographies consisting of 43,425,505 people shows a weak positive correlation between the proportion of Soviet Union and percentage of single father households in the United States with a correlation coefficient (R) of 0.222 and weighted average of 1.8%. Similarly, the statistical analysis conducted on geographies consisting of 562,897,212 people shows a mild positive correlation between the proportion of Germans and percentage of single father households in the United States with a correlation coefficient (R) of 0.324 and weighted average of 2.4%, a difference of 32.5%.
Single Father Households Correlation Summary
| Measurement | Soviet Union | German |
| Minimum | 0.25% | 0.56% |
| Maximum | 5.0% | 23.1% |
| Range | 4.7% | 22.5% |
| Mean | 1.9% | 3.0% |
| Median | 1.8% | 2.5% |
| Interquartile 25% (IQ1) | 1.2% | 2.3% |
| Interquartile 75% (IQ3) | 2.4% | 2.8% |
| Interquartile Range (IQR) | 1.2% | 0.50% |
| Standard Deviation (Sample) | 0.97% | 2.4% |
| Standard Deviation (Population) | 0.96% | 2.3% |
Similar Demographics by Single Father Households
Demographics Similar to Soviet Union by Single Father Households
In terms of single father households, the demographic groups most similar to Soviet Union are Immigrants from Israel (1.8%, a difference of 0.040%), Filipino (1.8%, a difference of 0.46%), Immigrants from Uzbekistan (1.8%, a difference of 1.1%), Immigrants from Hong Kong (1.8%, a difference of 2.1%), and Immigrants from Taiwan (1.8%, a difference of 2.5%).
| Demographics | Rating | Rank | Single Father Households |
| Soviet Union | 100.0 /100 | #1 | Exceptional 1.8% |
| Immigrants | Israel | 100.0 /100 | #2 | Exceptional 1.8% |
| Filipinos | 100.0 /100 | #3 | Exceptional 1.8% |
| Immigrants | Uzbekistan | 100.0 /100 | #4 | Exceptional 1.8% |
| Immigrants | Hong Kong | 100.0 /100 | #5 | Exceptional 1.8% |
| Immigrants | Taiwan | 100.0 /100 | #6 | Exceptional 1.8% |
| Cypriots | 100.0 /100 | #7 | Exceptional 1.8% |
| Immigrants | Ireland | 100.0 /100 | #8 | Exceptional 1.8% |
| Immigrants | China | 100.0 /100 | #9 | Exceptional 1.8% |
| Okinawans | 100.0 /100 | #10 | Exceptional 1.9% |
| Immigrants | Belarus | 100.0 /100 | #11 | Exceptional 1.9% |
| Immigrants | Greece | 100.0 /100 | #12 | Exceptional 1.9% |
| Immigrants | Singapore | 100.0 /100 | #13 | Exceptional 1.9% |
| Immigrants | Lithuania | 100.0 /100 | #14 | Exceptional 1.9% |
| Immigrants | Eastern Asia | 100.0 /100 | #15 | Exceptional 1.9% |
Demographics Similar to Germans by Single Father Households
In terms of single father households, the demographic groups most similar to Germans are Kenyan (2.4%, a difference of 0.0%), Scandinavian (2.4%, a difference of 0.050%), Immigrants from Philippines (2.4%, a difference of 0.060%), Immigrants from Vietnam (2.4%, a difference of 0.080%), and Peruvian (2.4%, a difference of 0.080%).
| Demographics | Rating | Rank | Single Father Households |
| French | 31.7 /100 | #190 | Fair 2.4% |
| Immigrants | Africa | 30.0 /100 | #191 | Fair 2.4% |
| Immigrants | Sudan | 29.8 /100 | #192 | Fair 2.4% |
| Uruguayans | 29.7 /100 | #193 | Fair 2.4% |
| Panamanians | 29.6 /100 | #194 | Fair 2.4% |
| Immigrants | Philippines | 28.7 /100 | #195 | Fair 2.4% |
| Kenyans | 28.0 /100 | #196 | Fair 2.4% |
| Germans | 28.0 /100 | #197 | Fair 2.4% |
| Scandinavians | 27.4 /100 | #198 | Fair 2.4% |
| Immigrants | Vietnam | 27.1 /100 | #199 | Fair 2.4% |
| Peruvians | 27.1 /100 | #200 | Fair 2.4% |
| Immigrants | Uganda | 26.0 /100 | #201 | Fair 2.4% |
| German Russians | 25.7 /100 | #202 | Fair 2.4% |
| French Canadians | 24.7 /100 | #203 | Fair 2.4% |
| Ecuadorians | 24.5 /100 | #204 | Fair 2.4% |