Immigrants from Dominica vs Arapaho Family Households
COMPARE
Immigrants from Dominica
Arapaho
Family Households
Family Households Comparison
Immigrants from Dominica
Arapaho
63.4%
FAMILY HOUSEHOLDS
1.6/ 100
METRIC RATING
245th/ 347
METRIC RANK
66.5%
FAMILY HOUSEHOLDS
100.0/ 100
METRIC RATING
46th/ 347
METRIC RANK
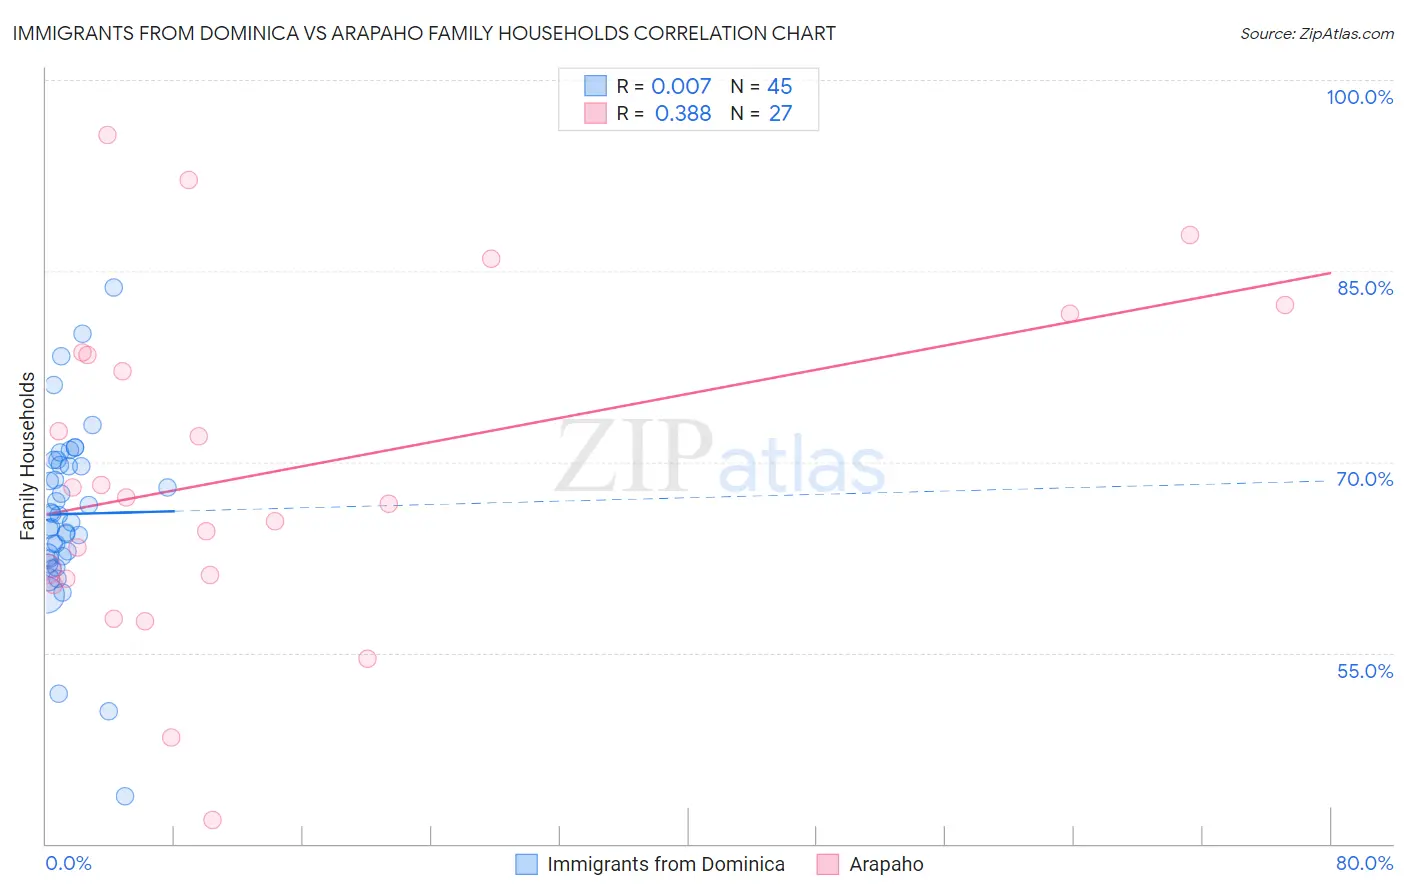
Immigrants from Dominica vs Arapaho Family Households Correlation Chart
The statistical analysis conducted on geographies consisting of 83,778,248 people shows no correlation between the proportion of Immigrants from Dominica and percentage of family households in the United States with a correlation coefficient (R) of 0.007 and weighted average of 63.4%. Similarly, the statistical analysis conducted on geographies consisting of 29,778,233 people shows a mild positive correlation between the proportion of Arapaho and percentage of family households in the United States with a correlation coefficient (R) of 0.388 and weighted average of 66.5%, a difference of 4.8%.
Family Households Correlation Summary
| Measurement | Immigrants from Dominica | Arapaho |
| Minimum | 43.8% | 41.9% |
| Maximum | 83.7% | 95.7% |
| Range | 39.9% | 53.8% |
| Mean | 65.9% | 69.3% |
| Median | 65.8% | 67.2% |
| Interquartile 25% (IQ1) | 62.5% | 60.8% |
| Interquartile 75% (IQ3) | 69.9% | 78.6% |
| Interquartile Range (IQR) | 7.5% | 17.8% |
| Standard Deviation (Sample) | 7.1% | 13.1% |
| Standard Deviation (Population) | 7.0% | 12.9% |
Similar Demographics by Family Households
Demographics Similar to Immigrants from Dominica by Family Households
In terms of family households, the demographic groups most similar to Immigrants from Dominica are Eastern European (63.4%, a difference of 0.0%), Immigrants from Ghana (63.4%, a difference of 0.020%), Immigrants from Czechoslovakia (63.4%, a difference of 0.030%), Immigrants from Uzbekistan (63.4%, a difference of 0.030%), and Immigrants from Israel (63.4%, a difference of 0.040%).
| Demographics | Rating | Rank | Family Households |
| Immigrants | Zimbabwe | 2.0 /100 | #238 | Tragic 63.5% |
| Aleuts | 1.9 /100 | #239 | Tragic 63.4% |
| South Africans | 1.9 /100 | #240 | Tragic 63.4% |
| Immigrants | St. Vincent and the Grenadines | 1.9 /100 | #241 | Tragic 63.4% |
| Immigrants | Israel | 1.8 /100 | #242 | Tragic 63.4% |
| Immigrants | Czechoslovakia | 1.8 /100 | #243 | Tragic 63.4% |
| Eastern Europeans | 1.6 /100 | #244 | Tragic 63.4% |
| Immigrants | Dominica | 1.6 /100 | #245 | Tragic 63.4% |
| Immigrants | Ghana | 1.6 /100 | #246 | Tragic 63.4% |
| Immigrants | Uzbekistan | 1.5 /100 | #247 | Tragic 63.4% |
| Dominicans | 1.5 /100 | #248 | Tragic 63.4% |
| Russians | 1.4 /100 | #249 | Tragic 63.4% |
| Immigrants | Japan | 1.4 /100 | #250 | Tragic 63.4% |
| Taiwanese | 1.2 /100 | #251 | Tragic 63.3% |
| Bahamians | 1.1 /100 | #252 | Tragic 63.3% |
Demographics Similar to Arapaho by Family Households
In terms of family households, the demographic groups most similar to Arapaho are Venezuelan (66.5%, a difference of 0.020%), Bolivian (66.5%, a difference of 0.030%), Asian (66.5%, a difference of 0.050%), Immigrants from Venezuela (66.4%, a difference of 0.050%), and Apache (66.5%, a difference of 0.090%).
| Demographics | Rating | Rank | Family Households |
| Immigrants | El Salvador | 100.0 /100 | #39 | Exceptional 67.0% |
| Guamanians/Chamorros | 100.0 /100 | #40 | Exceptional 66.6% |
| Immigrants | Bolivia | 100.0 /100 | #41 | Exceptional 66.6% |
| Menominee | 100.0 /100 | #42 | Exceptional 66.5% |
| Apache | 100.0 /100 | #43 | Exceptional 66.5% |
| Asians | 100.0 /100 | #44 | Exceptional 66.5% |
| Venezuelans | 100.0 /100 | #45 | Exceptional 66.5% |
| Arapaho | 100.0 /100 | #46 | Exceptional 66.5% |
| Bolivians | 100.0 /100 | #47 | Exceptional 66.5% |
| Immigrants | Venezuela | 100.0 /100 | #48 | Exceptional 66.4% |
| Immigrants | South Central Asia | 100.0 /100 | #49 | Exceptional 66.4% |
| Navajo | 100.0 /100 | #50 | Exceptional 66.4% |
| Natives/Alaskans | 100.0 /100 | #51 | Exceptional 66.4% |
| Colombians | 100.0 /100 | #52 | Exceptional 66.3% |
| Afghans | 100.0 /100 | #53 | Exceptional 66.3% |