Hungarian vs Syrian Currently Married
COMPARE
Hungarian
Syrian
Currently Married
Currently Married Comparison
Hungarians
Syrians
48.8%
CURRENTLY MARRIED
99.4/ 100
METRIC RATING
37th/ 347
METRIC RANK
47.5%
CURRENTLY MARRIED
88.9/ 100
METRIC RATING
120th/ 347
METRIC RANK
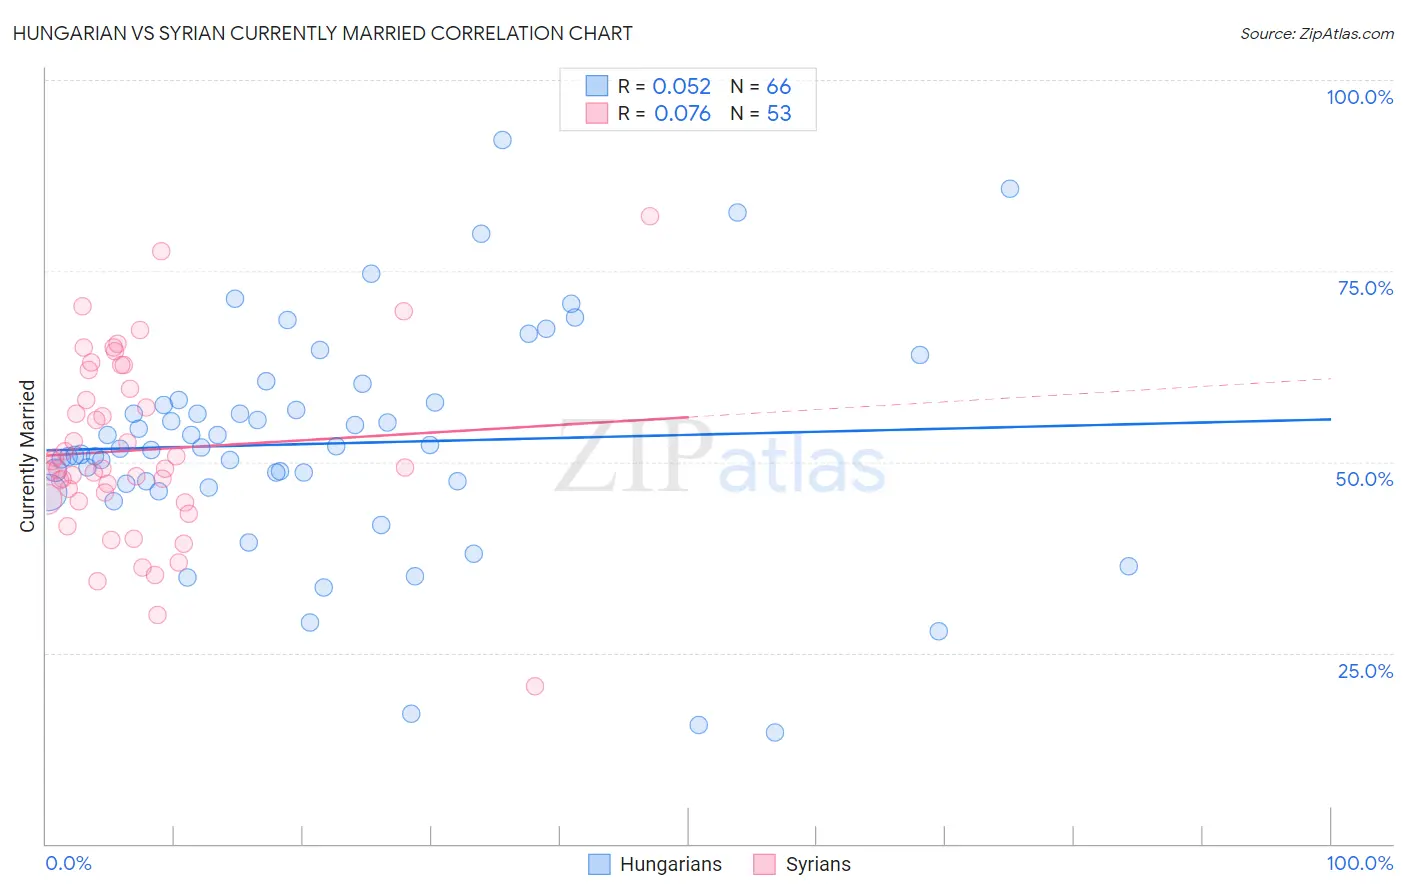
Hungarian vs Syrian Currently Married Correlation Chart
The statistical analysis conducted on geographies consisting of 486,182,197 people shows a slight positive correlation between the proportion of Hungarians and percentage of population currently married in the United States with a correlation coefficient (R) of 0.052 and weighted average of 48.8%. Similarly, the statistical analysis conducted on geographies consisting of 266,298,061 people shows a slight positive correlation between the proportion of Syrians and percentage of population currently married in the United States with a correlation coefficient (R) of 0.076 and weighted average of 47.5%, a difference of 2.8%.
Currently Married Correlation Summary
| Measurement | Hungarian | Syrian |
| Minimum | 14.5% | 20.6% |
| Maximum | 92.1% | 82.1% |
| Range | 77.6% | 61.5% |
| Mean | 52.4% | 51.6% |
| Median | 51.8% | 49.1% |
| Interquartile 25% (IQ1) | 47.1% | 45.0% |
| Interquartile 75% (IQ3) | 57.7% | 60.8% |
| Interquartile Range (IQR) | 10.6% | 15.7% |
| Standard Deviation (Sample) | 14.9% | 11.8% |
| Standard Deviation (Population) | 14.7% | 11.7% |
Similar Demographics by Currently Married
Demographics Similar to Hungarians by Currently Married
In terms of currently married, the demographic groups most similar to Hungarians are Italian (48.8%, a difference of 0.0%), Immigrants from Northern Europe (48.8%, a difference of 0.010%), Immigrants from Lithuania (48.8%, a difference of 0.030%), Czechoslovakian (48.8%, a difference of 0.040%), and British (48.8%, a difference of 0.070%).
| Demographics | Rating | Rank | Currently Married |
| Eastern Europeans | 99.5 /100 | #30 | Exceptional 48.9% |
| Poles | 99.5 /100 | #31 | Exceptional 48.9% |
| Immigrants | Hong Kong | 99.5 /100 | #32 | Exceptional 48.9% |
| Irish | 99.5 /100 | #33 | Exceptional 48.9% |
| Immigrants | Lithuania | 99.4 /100 | #34 | Exceptional 48.8% |
| Immigrants | Northern Europe | 99.4 /100 | #35 | Exceptional 48.8% |
| Italians | 99.4 /100 | #36 | Exceptional 48.8% |
| Hungarians | 99.4 /100 | #37 | Exceptional 48.8% |
| Czechoslovakians | 99.4 /100 | #38 | Exceptional 48.8% |
| British | 99.4 /100 | #39 | Exceptional 48.8% |
| Immigrants | Canada | 99.4 /100 | #40 | Exceptional 48.8% |
| Greeks | 99.3 /100 | #41 | Exceptional 48.8% |
| Finns | 99.3 /100 | #42 | Exceptional 48.8% |
| Scotch-Irish | 99.3 /100 | #43 | Exceptional 48.7% |
| Immigrants | North America | 99.3 /100 | #44 | Exceptional 48.7% |
Demographics Similar to Syrians by Currently Married
In terms of currently married, the demographic groups most similar to Syrians are Immigrants from Croatia (47.5%, a difference of 0.030%), Osage (47.5%, a difference of 0.090%), Immigrants from Philippines (47.6%, a difference of 0.12%), Australian (47.6%, a difference of 0.12%), and Puget Sound Salish (47.6%, a difference of 0.13%).
| Demographics | Rating | Rank | Currently Married |
| Immigrants | Denmark | 90.9 /100 | #113 | Exceptional 47.6% |
| South Africans | 90.5 /100 | #114 | Exceptional 47.6% |
| Immigrants | Indonesia | 90.5 /100 | #115 | Exceptional 47.6% |
| Palestinians | 90.4 /100 | #116 | Exceptional 47.6% |
| Puget Sound Salish | 90.3 /100 | #117 | Exceptional 47.6% |
| Immigrants | Philippines | 90.2 /100 | #118 | Exceptional 47.6% |
| Australians | 90.2 /100 | #119 | Exceptional 47.6% |
| Syrians | 88.9 /100 | #120 | Excellent 47.5% |
| Immigrants | Croatia | 88.6 /100 | #121 | Excellent 47.5% |
| Osage | 87.9 /100 | #122 | Excellent 47.5% |
| Immigrants | Kazakhstan | 87.2 /100 | #123 | Excellent 47.4% |
| Laotians | 86.6 /100 | #124 | Excellent 47.4% |
| Okinawans | 85.3 /100 | #125 | Excellent 47.4% |
| Immigrants | Jordan | 84.9 /100 | #126 | Excellent 47.4% |
| New Zealanders | 84.9 /100 | #127 | Excellent 47.4% |