Immigrants from Caribbean vs Bangladeshi Family Households
COMPARE
Immigrants from Caribbean
Bangladeshi
Family Households
Family Households Comparison
Immigrants from Caribbean
Bangladeshis
65.3%
FAMILY HOUSEHOLDS
99.1/ 100
METRIC RATING
89th/ 347
METRIC RANK
64.3%
FAMILY HOUSEHOLDS
44.3/ 100
METRIC RATING
175th/ 347
METRIC RANK
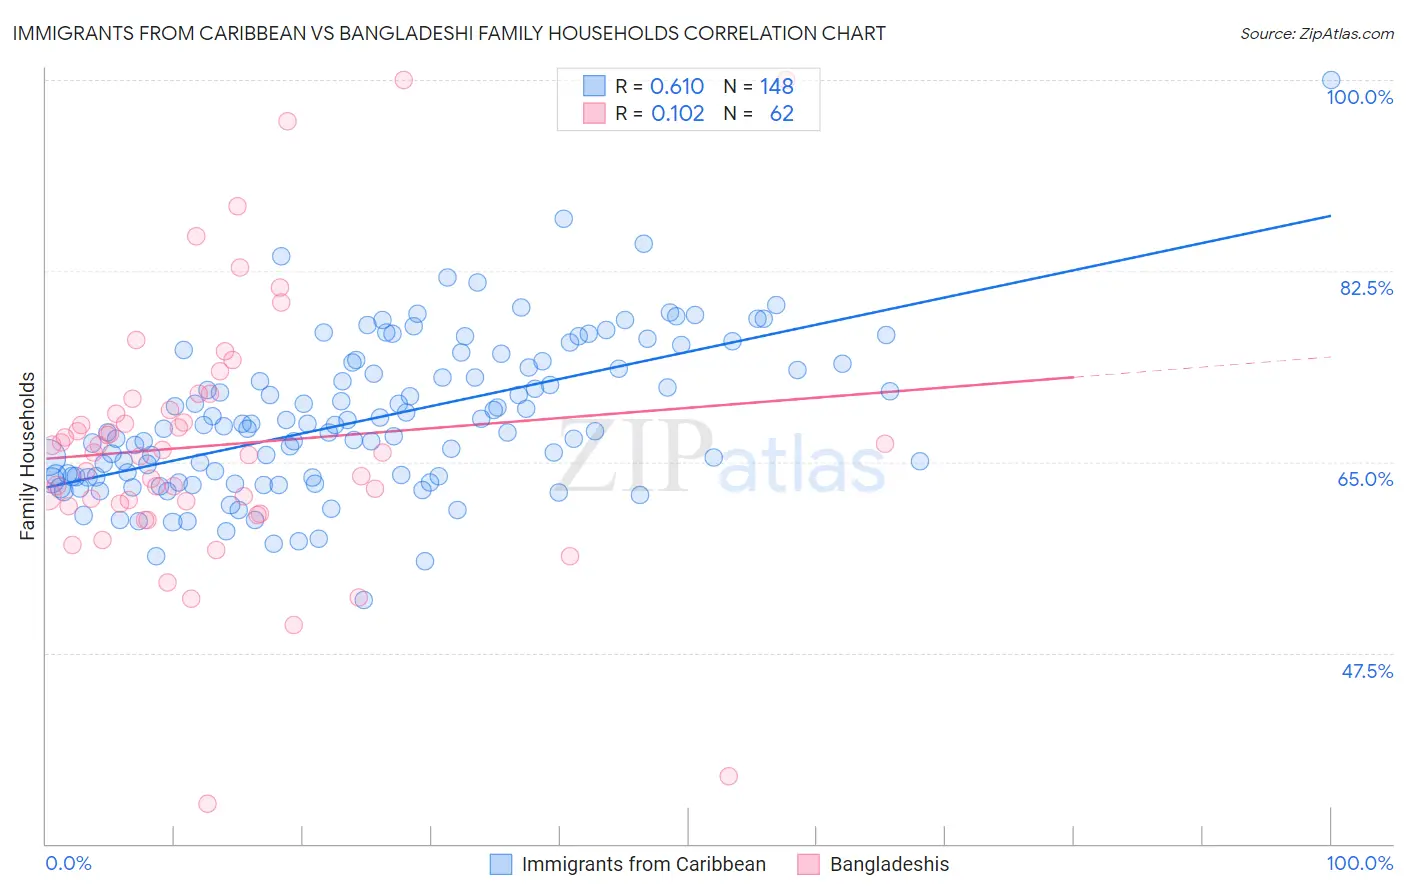
Immigrants from Caribbean vs Bangladeshi Family Households Correlation Chart
The statistical analysis conducted on geographies consisting of 449,694,372 people shows a significant positive correlation between the proportion of Immigrants from Caribbean and percentage of family households in the United States with a correlation coefficient (R) of 0.610 and weighted average of 65.3%. Similarly, the statistical analysis conducted on geographies consisting of 141,333,062 people shows a poor positive correlation between the proportion of Bangladeshis and percentage of family households in the United States with a correlation coefficient (R) of 0.102 and weighted average of 64.3%, a difference of 1.7%.
Family Households Correlation Summary
| Measurement | Immigrants from Caribbean | Bangladeshi |
| Minimum | 52.4% | 33.7% |
| Maximum | 100.0% | 100.0% |
| Range | 47.6% | 66.3% |
| Mean | 68.9% | 66.5% |
| Median | 68.2% | 65.9% |
| Interquartile 25% (IQ1) | 63.6% | 61.1% |
| Interquartile 75% (IQ3) | 73.8% | 69.8% |
| Interquartile Range (IQR) | 10.2% | 8.7% |
| Standard Deviation (Sample) | 7.1% | 11.9% |
| Standard Deviation (Population) | 7.1% | 11.8% |
Similar Demographics by Family Households
Demographics Similar to Immigrants from Caribbean by Family Households
In terms of family households, the demographic groups most similar to Immigrants from Caribbean are Immigrants from Haiti (65.3%, a difference of 0.010%), Immigrants from Laos (65.3%, a difference of 0.010%), Immigrants from Egypt (65.3%, a difference of 0.040%), Crow (65.3%, a difference of 0.060%), and Hopi (65.3%, a difference of 0.10%).
| Demographics | Rating | Rank | Family Households |
| Immigrants | Lebanon | 99.7 /100 | #82 | Exceptional 65.5% |
| Immigrants | Guyana | 99.6 /100 | #83 | Exceptional 65.5% |
| Americans | 99.6 /100 | #84 | Exceptional 65.5% |
| Immigrants | Cambodia | 99.5 /100 | #85 | Exceptional 65.4% |
| Egyptians | 99.4 /100 | #86 | Exceptional 65.4% |
| Immigrants | Egypt | 99.2 /100 | #87 | Exceptional 65.3% |
| Immigrants | Haiti | 99.1 /100 | #88 | Exceptional 65.3% |
| Immigrants | Caribbean | 99.1 /100 | #89 | Exceptional 65.3% |
| Immigrants | Laos | 99.1 /100 | #90 | Exceptional 65.3% |
| Crow | 98.9 /100 | #91 | Exceptional 65.3% |
| Hopi | 98.8 /100 | #92 | Exceptional 65.3% |
| Guyanese | 98.8 /100 | #93 | Exceptional 65.3% |
| Immigrants | Poland | 98.7 /100 | #94 | Exceptional 65.2% |
| Immigrants | Portugal | 98.6 /100 | #95 | Exceptional 65.2% |
| Swiss | 98.6 /100 | #96 | Exceptional 65.2% |
Demographics Similar to Bangladeshis by Family Households
In terms of family households, the demographic groups most similar to Bangladeshis are Vietnamese (64.2%, a difference of 0.010%), Immigrants from Micronesia (64.2%, a difference of 0.030%), Jamaican (64.2%, a difference of 0.050%), Immigrants from Germany (64.3%, a difference of 0.080%), and Immigrants from Ukraine (64.2%, a difference of 0.080%).
| Demographics | Rating | Rank | Family Households |
| Hondurans | 57.5 /100 | #168 | Average 64.4% |
| Iraqis | 56.0 /100 | #169 | Average 64.4% |
| Armenians | 55.9 /100 | #170 | Average 64.4% |
| Ute | 54.6 /100 | #171 | Average 64.3% |
| Dutch West Indians | 53.9 /100 | #172 | Average 64.3% |
| Immigrants | Sierra Leone | 52.5 /100 | #173 | Average 64.3% |
| Immigrants | Germany | 50.0 /100 | #174 | Average 64.3% |
| Bangladeshis | 44.3 /100 | #175 | Average 64.3% |
| Vietnamese | 43.6 /100 | #176 | Average 64.2% |
| Immigrants | Micronesia | 42.3 /100 | #177 | Average 64.2% |
| Jamaicans | 40.6 /100 | #178 | Average 64.2% |
| Immigrants | Ukraine | 38.2 /100 | #179 | Fair 64.2% |
| Immigrants | Honduras | 35.0 /100 | #180 | Fair 64.2% |
| Immigrants | Trinidad and Tobago | 34.9 /100 | #181 | Fair 64.2% |
| Ukrainians | 34.6 /100 | #182 | Fair 64.2% |