Immigrants from Caribbean vs Lebanese Family Households
COMPARE
Immigrants from Caribbean
Lebanese
Family Households
Family Households Comparison
Immigrants from Caribbean
Lebanese
65.3%
FAMILY HOUSEHOLDS
99.1/ 100
METRIC RATING
89th/ 347
METRIC RANK
64.4%
FAMILY HOUSEHOLDS
66.4/ 100
METRIC RATING
158th/ 347
METRIC RANK
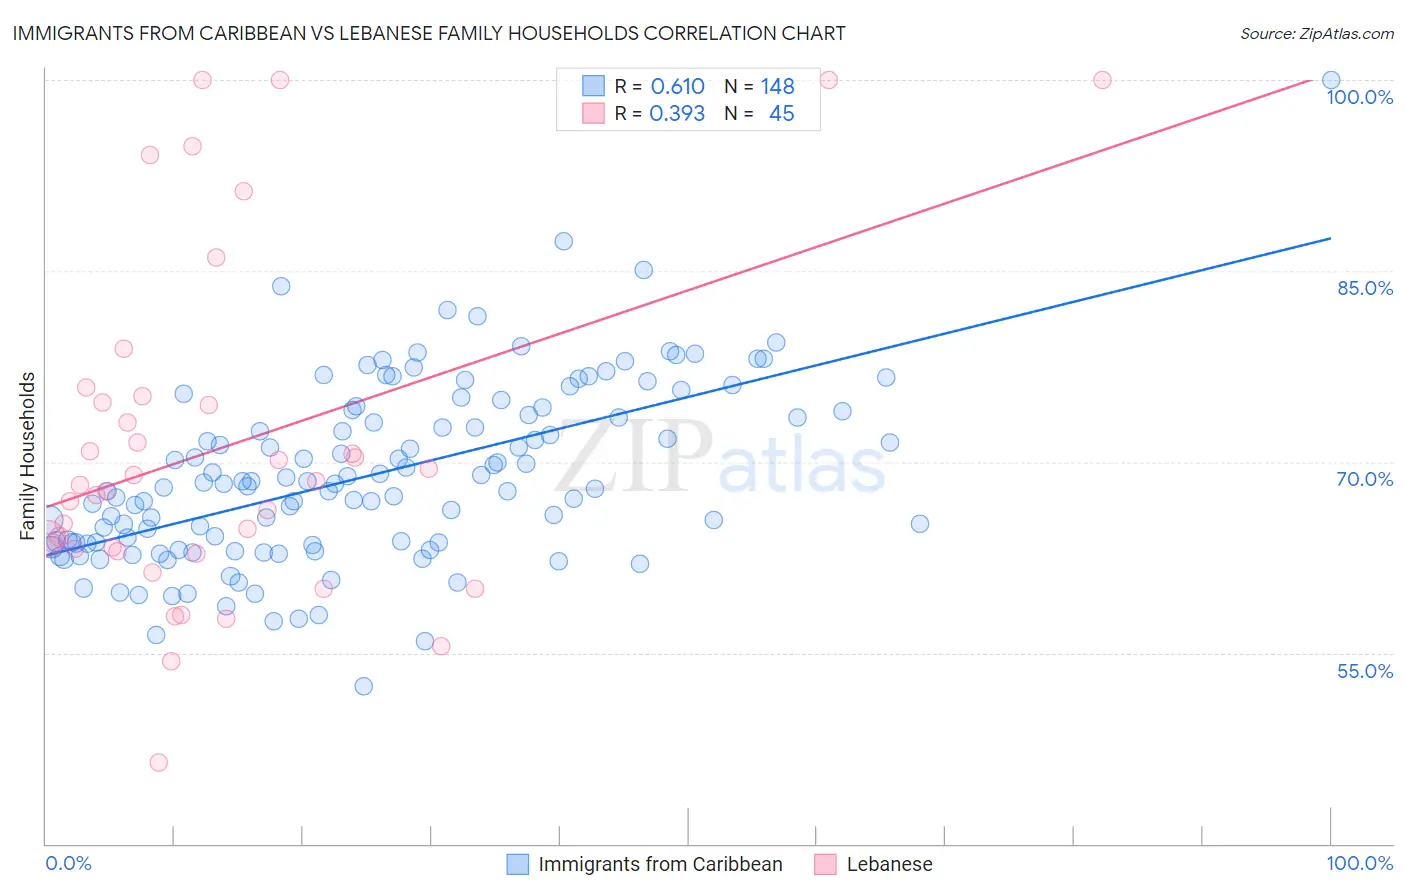
Immigrants from Caribbean vs Lebanese Family Households Correlation Chart
The statistical analysis conducted on geographies consisting of 449,694,372 people shows a significant positive correlation between the proportion of Immigrants from Caribbean and percentage of family households in the United States with a correlation coefficient (R) of 0.610 and weighted average of 65.3%. Similarly, the statistical analysis conducted on geographies consisting of 401,332,213 people shows a mild positive correlation between the proportion of Lebanese and percentage of family households in the United States with a correlation coefficient (R) of 0.393 and weighted average of 64.4%, a difference of 1.3%.
Family Households Correlation Summary
| Measurement | Immigrants from Caribbean | Lebanese |
| Minimum | 52.4% | 46.4% |
| Maximum | 100.0% | 100.0% |
| Range | 47.6% | 53.6% |
| Mean | 68.9% | 71.1% |
| Median | 68.2% | 68.2% |
| Interquartile 25% (IQ1) | 63.6% | 63.1% |
| Interquartile 75% (IQ3) | 73.8% | 74.9% |
| Interquartile Range (IQR) | 10.2% | 11.8% |
| Standard Deviation (Sample) | 7.1% | 13.3% |
| Standard Deviation (Population) | 7.1% | 13.1% |
Similar Demographics by Family Households
Demographics Similar to Immigrants from Caribbean by Family Households
In terms of family households, the demographic groups most similar to Immigrants from Caribbean are Immigrants from Haiti (65.3%, a difference of 0.010%), Immigrants from Laos (65.3%, a difference of 0.010%), Immigrants from Egypt (65.3%, a difference of 0.040%), Crow (65.3%, a difference of 0.060%), and Hopi (65.3%, a difference of 0.10%).
| Demographics | Rating | Rank | Family Households |
| Immigrants | Lebanon | 99.7 /100 | #82 | Exceptional 65.5% |
| Immigrants | Guyana | 99.6 /100 | #83 | Exceptional 65.5% |
| Americans | 99.6 /100 | #84 | Exceptional 65.5% |
| Immigrants | Cambodia | 99.5 /100 | #85 | Exceptional 65.4% |
| Egyptians | 99.4 /100 | #86 | Exceptional 65.4% |
| Immigrants | Egypt | 99.2 /100 | #87 | Exceptional 65.3% |
| Immigrants | Haiti | 99.1 /100 | #88 | Exceptional 65.3% |
| Immigrants | Caribbean | 99.1 /100 | #89 | Exceptional 65.3% |
| Immigrants | Laos | 99.1 /100 | #90 | Exceptional 65.3% |
| Crow | 98.9 /100 | #91 | Exceptional 65.3% |
| Hopi | 98.8 /100 | #92 | Exceptional 65.3% |
| Guyanese | 98.8 /100 | #93 | Exceptional 65.3% |
| Immigrants | Poland | 98.7 /100 | #94 | Exceptional 65.2% |
| Immigrants | Portugal | 98.6 /100 | #95 | Exceptional 65.2% |
| Swiss | 98.6 /100 | #96 | Exceptional 65.2% |
Demographics Similar to Lebanese by Family Households
In terms of family households, the demographic groups most similar to Lebanese are Canadian (64.4%, a difference of 0.0%), Czech (64.5%, a difference of 0.010%), German (64.4%, a difference of 0.010%), Uruguayan (64.5%, a difference of 0.020%), and Immigrants from Moldova (64.4%, a difference of 0.020%).
| Demographics | Rating | Rank | Family Households |
| Syrians | 75.2 /100 | #151 | Good 64.5% |
| Scottish | 70.9 /100 | #152 | Good 64.5% |
| Swedes | 69.8 /100 | #153 | Good 64.5% |
| Austrians | 68.5 /100 | #154 | Good 64.5% |
| Uruguayans | 67.7 /100 | #155 | Good 64.5% |
| Czechs | 67.0 /100 | #156 | Good 64.5% |
| Canadians | 66.6 /100 | #157 | Good 64.4% |
| Lebanese | 66.4 /100 | #158 | Good 64.4% |
| Germans | 65.8 /100 | #159 | Good 64.4% |
| Immigrants | Moldova | 65.2 /100 | #160 | Good 64.4% |
| Immigrants | England | 62.6 /100 | #161 | Good 64.4% |
| British | 61.6 /100 | #162 | Good 64.4% |
| Chickasaw | 61.5 /100 | #163 | Good 64.4% |
| Immigrants | Nigeria | 60.1 /100 | #164 | Good 64.4% |
| Immigrants | Southern Europe | 60.0 /100 | #165 | Good 64.4% |