Immigrants from Canada vs French Canadian Births to Unmarried Women
COMPARE
Immigrants from Canada
French Canadian
Births to Unmarried Women
Births to Unmarried Women Comparison
Immigrants from Canada
French Canadians
30.4%
BIRTHS TO UNMARRIED WOMEN
83.7/ 100
METRIC RATING
139th/ 347
METRIC RANK
34.4%
BIRTHS TO UNMARRIED WOMEN
2.5/ 100
METRIC RATING
232nd/ 347
METRIC RANK
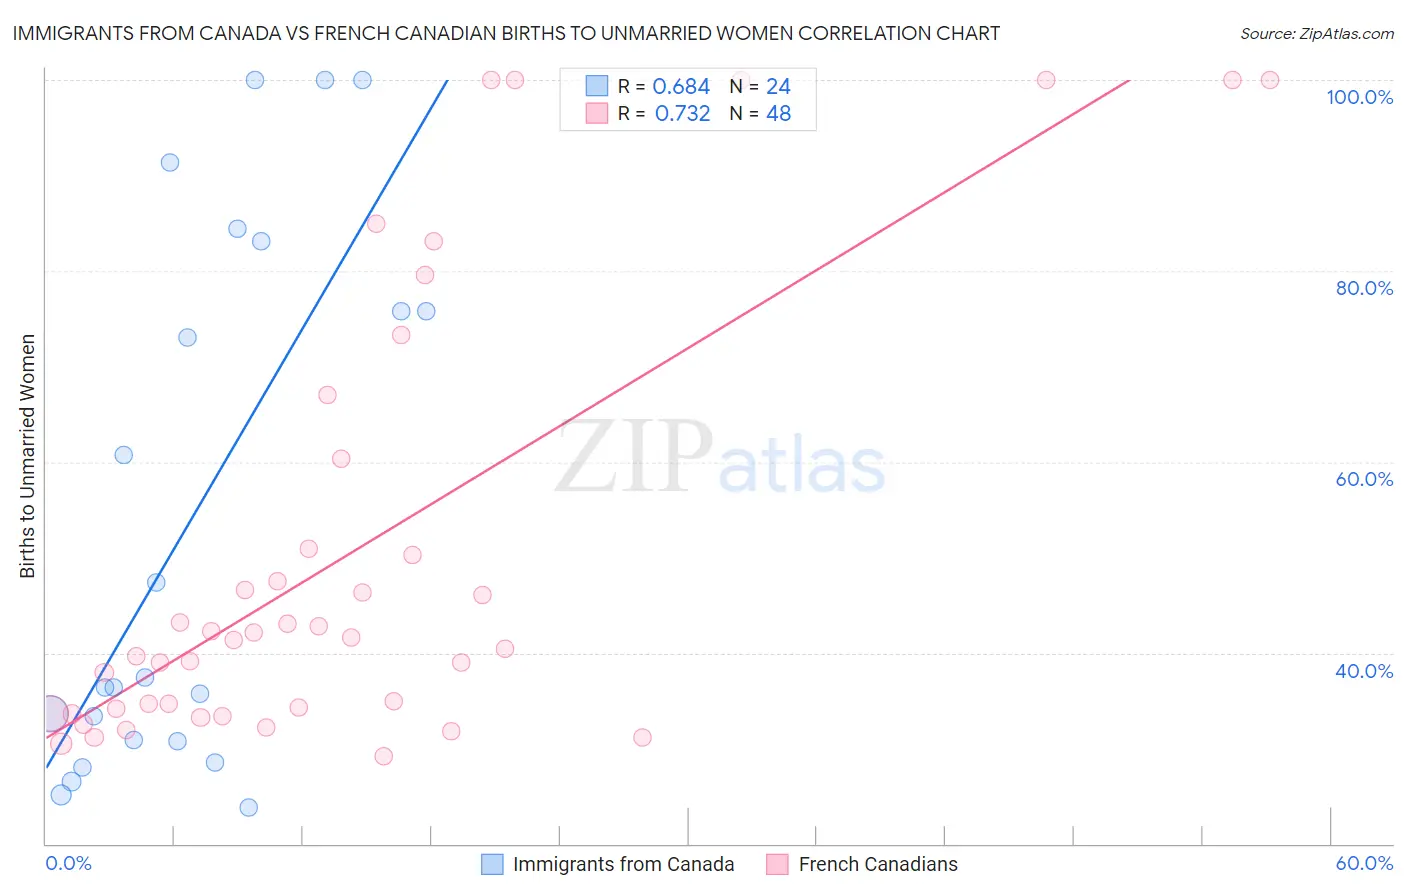
Immigrants from Canada vs French Canadian Births to Unmarried Women Correlation Chart
The statistical analysis conducted on geographies consisting of 419,760,568 people shows a significant positive correlation between the proportion of Immigrants from Canada and percentage of births to unmarried women in the United States with a correlation coefficient (R) of 0.684 and weighted average of 30.4%. Similarly, the statistical analysis conducted on geographies consisting of 454,698,687 people shows a strong positive correlation between the proportion of French Canadians and percentage of births to unmarried women in the United States with a correlation coefficient (R) of 0.732 and weighted average of 34.4%, a difference of 13.0%.
Births to Unmarried Women Correlation Summary
| Measurement | Immigrants from Canada | French Canadian |
| Minimum | 23.8% | 29.1% |
| Maximum | 100.0% | 100.0% |
| Range | 76.2% | 70.9% |
| Mean | 54.1% | 50.5% |
| Median | 36.9% | 41.5% |
| Interquartile 25% (IQ1) | 30.8% | 33.9% |
| Interquartile 75% (IQ3) | 79.4% | 55.6% |
| Interquartile Range (IQR) | 48.7% | 21.7% |
| Standard Deviation (Sample) | 27.9% | 23.2% |
| Standard Deviation (Population) | 27.3% | 23.0% |
Similar Demographics by Births to Unmarried Women
Demographics Similar to Immigrants from Canada by Births to Unmarried Women
In terms of births to unmarried women, the demographic groups most similar to Immigrants from Canada are Puget Sound Salish (30.4%, a difference of 0.030%), Immigrants from Philippines (30.4%, a difference of 0.040%), Swiss (30.5%, a difference of 0.11%), Pakistani (30.5%, a difference of 0.13%), and Immigrants from Scotland (30.4%, a difference of 0.16%).
| Demographics | Rating | Rank | Births to Unmarried Women |
| New Zealanders | 85.5 /100 | #132 | Excellent 30.3% |
| Immigrants | Morocco | 85.2 /100 | #133 | Excellent 30.4% |
| Immigrants | South Eastern Asia | 85.2 /100 | #134 | Excellent 30.4% |
| Brazilians | 84.8 /100 | #135 | Excellent 30.4% |
| Immigrants | Scotland | 84.6 /100 | #136 | Excellent 30.4% |
| Immigrants | Philippines | 83.9 /100 | #137 | Excellent 30.4% |
| Puget Sound Salish | 83.9 /100 | #138 | Excellent 30.4% |
| Immigrants | Canada | 83.7 /100 | #139 | Excellent 30.4% |
| Swiss | 83.1 /100 | #140 | Excellent 30.5% |
| Pakistanis | 83.0 /100 | #141 | Excellent 30.5% |
| South Africans | 82.7 /100 | #142 | Excellent 30.5% |
| Immigrants | Uganda | 82.6 /100 | #143 | Excellent 30.5% |
| Czechs | 82.1 /100 | #144 | Excellent 30.5% |
| Immigrants | North America | 81.5 /100 | #145 | Excellent 30.6% |
| Northern Europeans | 81.4 /100 | #146 | Excellent 30.6% |
Demographics Similar to French Canadians by Births to Unmarried Women
In terms of births to unmarried women, the demographic groups most similar to French Canadians are Bangladeshi (34.4%, a difference of 0.020%), Immigrants from Zaire (34.5%, a difference of 0.26%), Native Hawaiian (34.3%, a difference of 0.30%), Immigrants from Ghana (34.5%, a difference of 0.33%), and Ghanaian (34.3%, a difference of 0.44%).
| Demographics | Rating | Rank | Births to Unmarried Women |
| Spanish | 4.0 /100 | #225 | Tragic 34.1% |
| Delaware | 3.3 /100 | #226 | Tragic 34.2% |
| Immigrants | Panama | 3.3 /100 | #227 | Tragic 34.2% |
| Panamanians | 3.3 /100 | #228 | Tragic 34.2% |
| Immigrants | Sierra Leone | 3.1 /100 | #229 | Tragic 34.2% |
| Ghanaians | 3.1 /100 | #230 | Tragic 34.3% |
| Native Hawaiians | 2.9 /100 | #231 | Tragic 34.3% |
| French Canadians | 2.5 /100 | #232 | Tragic 34.4% |
| Bangladeshis | 2.5 /100 | #233 | Tragic 34.4% |
| Immigrants | Zaire | 2.3 /100 | #234 | Tragic 34.5% |
| Immigrants | Ghana | 2.2 /100 | #235 | Tragic 34.5% |
| Immigrants | Cameroon | 1.6 /100 | #236 | Tragic 34.7% |
| Marshallese | 1.6 /100 | #237 | Tragic 34.8% |
| Immigrants | Cambodia | 1.6 /100 | #238 | Tragic 34.8% |
| Sierra Leoneans | 1.4 /100 | #239 | Tragic 34.9% |