Immigrants from Burma/Myanmar vs Blackfeet 3rd Grade
COMPARE
Immigrants from Burma/Myanmar
Blackfeet
3rd Grade
3rd Grade Comparison
Immigrants from Burma/Myanmar
Blackfeet
96.6%
3RD GRADE
0.0/ 100
METRIC RATING
316th/ 347
METRIC RANK
97.9%
3RD GRADE
86.3/ 100
METRIC RATING
139th/ 347
METRIC RANK
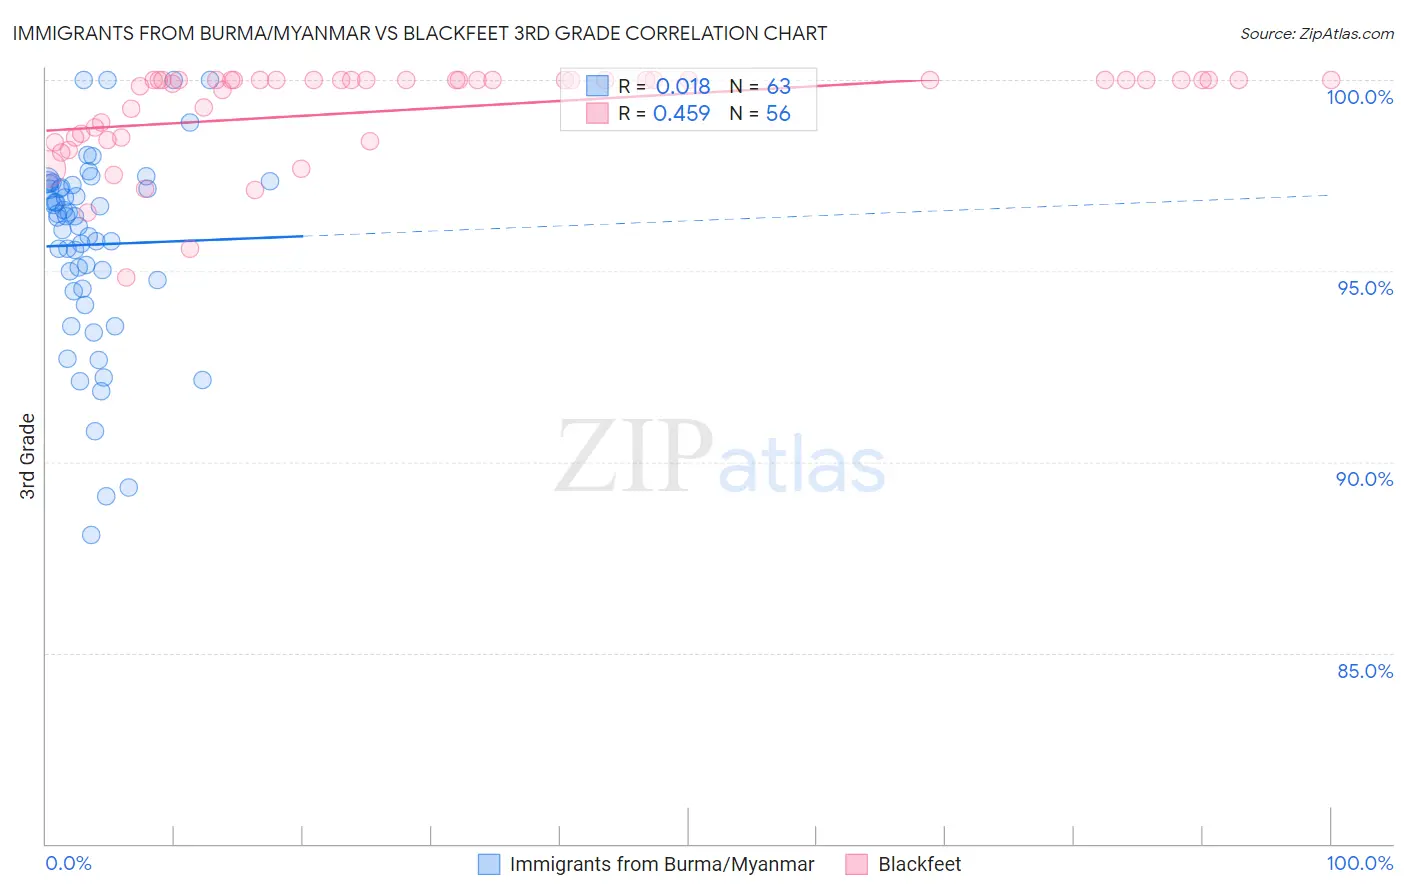
Immigrants from Burma/Myanmar vs Blackfeet 3rd Grade Correlation Chart
The statistical analysis conducted on geographies consisting of 172,338,093 people shows no correlation between the proportion of Immigrants from Burma/Myanmar and percentage of population with at least 3rd grade education in the United States with a correlation coefficient (R) of 0.018 and weighted average of 96.6%. Similarly, the statistical analysis conducted on geographies consisting of 309,580,957 people shows a moderate positive correlation between the proportion of Blackfeet and percentage of population with at least 3rd grade education in the United States with a correlation coefficient (R) of 0.459 and weighted average of 97.9%, a difference of 1.4%.
3rd Grade Correlation Summary
| Measurement | Immigrants from Burma/Myanmar | Blackfeet |
| Minimum | 88.1% | 94.8% |
| Maximum | 100.0% | 100.0% |
| Range | 11.9% | 5.2% |
| Mean | 95.7% | 99.2% |
| Median | 96.4% | 100.0% |
| Interquartile 25% (IQ1) | 94.5% | 98.5% |
| Interquartile 75% (IQ3) | 97.3% | 100.0% |
| Interquartile Range (IQR) | 2.7% | 1.5% |
| Standard Deviation (Sample) | 2.5% | 1.2% |
| Standard Deviation (Population) | 2.5% | 1.2% |
Similar Demographics by 3rd Grade
Demographics Similar to Immigrants from Burma/Myanmar by 3rd Grade
In terms of 3rd grade, the demographic groups most similar to Immigrants from Burma/Myanmar are Immigrants from the Azores (96.6%, a difference of 0.010%), Immigrants from Ecuador (96.6%, a difference of 0.020%), Belizean (96.6%, a difference of 0.020%), Immigrants from Bangladesh (96.6%, a difference of 0.020%), and Immigrants from Laos (96.6%, a difference of 0.030%).
| Demographics | Rating | Rank | 3rd Grade |
| Sri Lankans | 0.0 /100 | #309 | Tragic 96.7% |
| Cape Verdeans | 0.0 /100 | #310 | Tragic 96.6% |
| Immigrants | Guyana | 0.0 /100 | #311 | Tragic 96.6% |
| Immigrants | Laos | 0.0 /100 | #312 | Tragic 96.6% |
| Immigrants | Ecuador | 0.0 /100 | #313 | Tragic 96.6% |
| Belizeans | 0.0 /100 | #314 | Tragic 96.6% |
| Immigrants | Azores | 0.0 /100 | #315 | Tragic 96.6% |
| Immigrants | Burma/Myanmar | 0.0 /100 | #316 | Tragic 96.6% |
| Immigrants | Bangladesh | 0.0 /100 | #317 | Tragic 96.6% |
| Hispanics or Latinos | 0.0 /100 | #318 | Tragic 96.5% |
| Vietnamese | 0.0 /100 | #319 | Tragic 96.5% |
| Immigrants | Nicaragua | 0.0 /100 | #320 | Tragic 96.5% |
| Indonesians | 0.0 /100 | #321 | Tragic 96.5% |
| Immigrants | Belize | 0.0 /100 | #322 | Tragic 96.5% |
| Hondurans | 0.0 /100 | #323 | Tragic 96.5% |
Demographics Similar to Blackfeet by 3rd Grade
In terms of 3rd grade, the demographic groups most similar to Blackfeet are Israeli (97.9%, a difference of 0.0%), Cambodian (97.9%, a difference of 0.010%), Spaniard (97.9%, a difference of 0.010%), Immigrants from Romania (97.9%, a difference of 0.010%), and Palestinian (97.9%, a difference of 0.010%).
| Demographics | Rating | Rank | 3rd Grade |
| Immigrants | Hungary | 88.8 /100 | #132 | Excellent 97.9% |
| Immigrants | Kuwait | 88.7 /100 | #133 | Excellent 97.9% |
| Seminole | 88.7 /100 | #134 | Excellent 97.9% |
| Cambodians | 88.1 /100 | #135 | Excellent 97.9% |
| Spaniards | 87.9 /100 | #136 | Excellent 97.9% |
| Immigrants | Romania | 87.9 /100 | #137 | Excellent 97.9% |
| Israelis | 86.6 /100 | #138 | Excellent 97.9% |
| Blackfeet | 86.3 /100 | #139 | Excellent 97.9% |
| Palestinians | 84.6 /100 | #140 | Excellent 97.9% |
| Immigrants | Turkey | 83.5 /100 | #141 | Excellent 97.9% |
| Hmong | 80.3 /100 | #142 | Excellent 97.9% |
| Filipinos | 79.9 /100 | #143 | Good 97.9% |
| Burmese | 79.6 /100 | #144 | Good 97.9% |
| Immigrants | Greece | 79.5 /100 | #145 | Good 97.9% |
| Alsatians | 78.3 /100 | #146 | Good 97.9% |