Immigrants from Belgium vs Immigrants from Jordan Married-couple Households
COMPARE
Immigrants from Belgium
Immigrants from Jordan
Married-couple Households
Married-couple Households Comparison
Immigrants from Belgium
Immigrants from Jordan
47.9%
MARRIED-COUPLE HOUSEHOLDS
96.8/ 100
METRIC RATING
95th/ 347
METRIC RANK
47.7%
MARRIED-COUPLE HOUSEHOLDS
94.1/ 100
METRIC RATING
109th/ 347
METRIC RANK
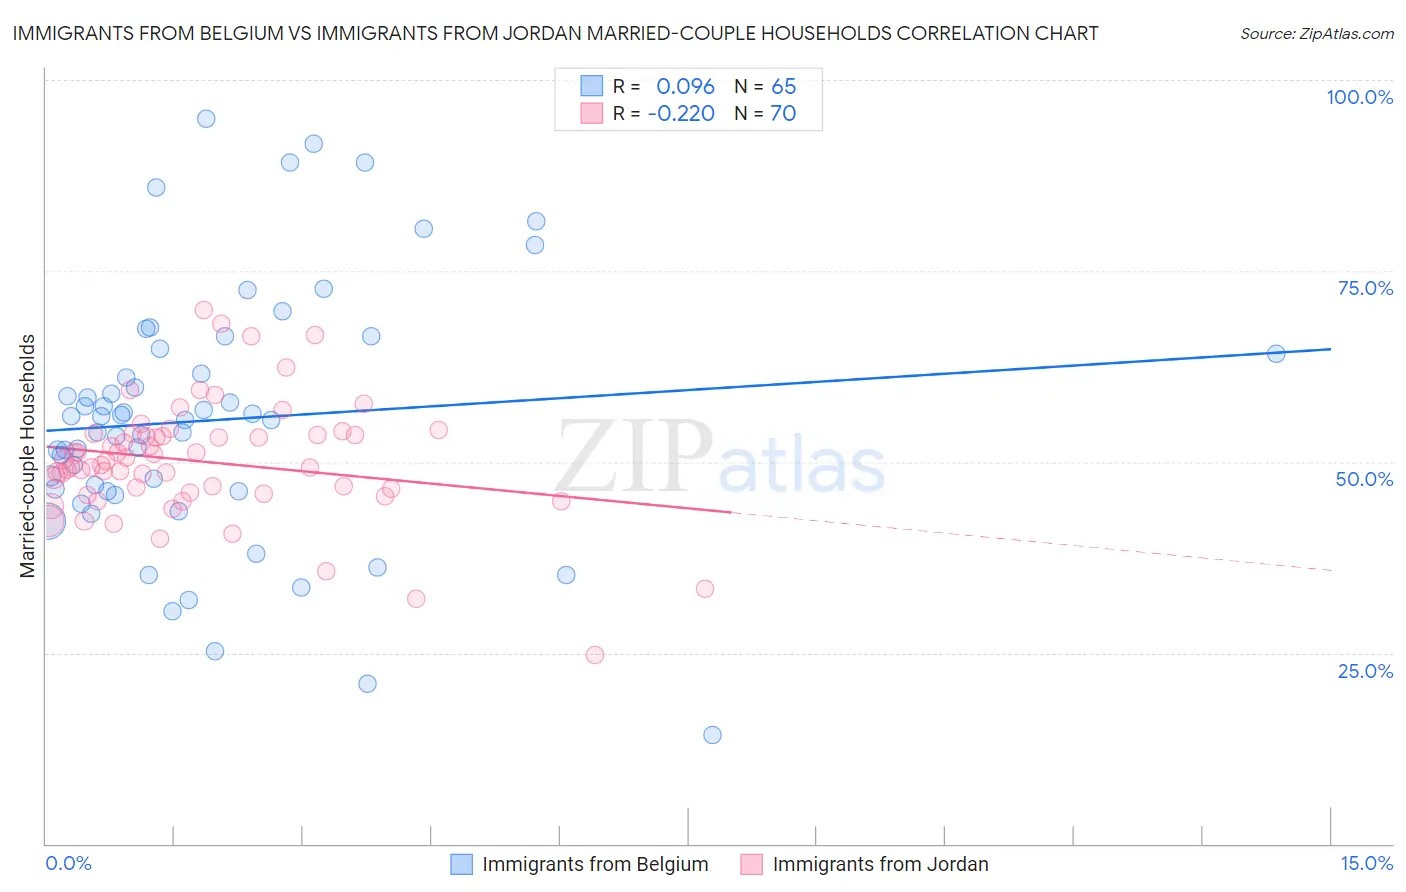
Immigrants from Belgium vs Immigrants from Jordan Married-couple Households Correlation Chart
The statistical analysis conducted on geographies consisting of 146,698,570 people shows a slight positive correlation between the proportion of Immigrants from Belgium and percentage of married-couple family households in the United States with a correlation coefficient (R) of 0.096 and weighted average of 47.9%. Similarly, the statistical analysis conducted on geographies consisting of 181,252,999 people shows a weak negative correlation between the proportion of Immigrants from Jordan and percentage of married-couple family households in the United States with a correlation coefficient (R) of -0.220 and weighted average of 47.7%, a difference of 0.58%.
Married-couple Households Correlation Summary
| Measurement | Immigrants from Belgium | Immigrants from Jordan |
| Minimum | 14.3% | 24.7% |
| Maximum | 94.9% | 69.8% |
| Range | 80.6% | 45.1% |
| Mean | 55.5% | 50.1% |
| Median | 55.5% | 49.9% |
| Interquartile 25% (IQ1) | 46.1% | 46.0% |
| Interquartile 75% (IQ3) | 64.5% | 53.6% |
| Interquartile Range (IQR) | 18.4% | 7.5% |
| Standard Deviation (Sample) | 16.6% | 7.7% |
| Standard Deviation (Population) | 16.5% | 7.7% |
Demographics Similar to Immigrants from Belgium and Immigrants from Jordan by Married-couple Households
In terms of married-couple households, the demographic groups most similar to Immigrants from Belgium are American (47.9%, a difference of 0.030%), Lebanese (47.9%, a difference of 0.040%), Immigrants from Egypt (47.9%, a difference of 0.050%), Palestinian (48.0%, a difference of 0.060%), and Latvian (47.9%, a difference of 0.080%). Similarly, the demographic groups most similar to Immigrants from Jordan are Macedonian (47.6%, a difference of 0.020%), Syrian (47.6%, a difference of 0.030%), Peruvian (47.6%, a difference of 0.040%), Immigrants from Japan (47.7%, a difference of 0.050%), and Estonian (47.7%, a difference of 0.10%).
| Demographics | Rating | Rank | Married-couple Households |
| Palestinians | 96.9 /100 | #92 | Exceptional 48.0% |
| Lebanese | 96.9 /100 | #93 | Exceptional 47.9% |
| Americans | 96.9 /100 | #94 | Exceptional 47.9% |
| Immigrants | Belgium | 96.8 /100 | #95 | Exceptional 47.9% |
| Immigrants | Egypt | 96.6 /100 | #96 | Exceptional 47.9% |
| Latvians | 96.5 /100 | #97 | Exceptional 47.9% |
| Immigrants | North Macedonia | 96.4 /100 | #98 | Exceptional 47.9% |
| Immigrants | Austria | 96.4 /100 | #99 | Exceptional 47.9% |
| Immigrants | Italy | 96.3 /100 | #100 | Exceptional 47.9% |
| Turks | 96.1 /100 | #101 | Exceptional 47.8% |
| Slavs | 96.0 /100 | #102 | Exceptional 47.8% |
| Hawaiians | 96.0 /100 | #103 | Exceptional 47.8% |
| Immigrants | South Africa | 96.0 /100 | #104 | Exceptional 47.8% |
| Immigrants | Czechoslovakia | 95.5 /100 | #105 | Exceptional 47.8% |
| Portuguese | 95.5 /100 | #106 | Exceptional 47.8% |
| Estonians | 94.7 /100 | #107 | Exceptional 47.7% |
| Immigrants | Japan | 94.4 /100 | #108 | Exceptional 47.7% |
| Immigrants | Jordan | 94.1 /100 | #109 | Exceptional 47.7% |
| Macedonians | 93.9 /100 | #110 | Exceptional 47.6% |
| Syrians | 93.9 /100 | #111 | Exceptional 47.6% |
| Peruvians | 93.8 /100 | #112 | Exceptional 47.6% |