Immigrants from Barbados vs Immigrants from Caribbean Family Households with Children
COMPARE
Immigrants from Barbados
Immigrants from Caribbean
Family Households with Children
Family Households with Children Comparison
Immigrants from Barbados
Immigrants from Caribbean
26.0%
FAMILY HOUSEHOLDS WITH CHILDREN
0.0/ 100
METRIC RATING
327th/ 347
METRIC RANK
27.0%
FAMILY HOUSEHOLDS WITH CHILDREN
6.3/ 100
METRIC RATING
229th/ 347
METRIC RANK
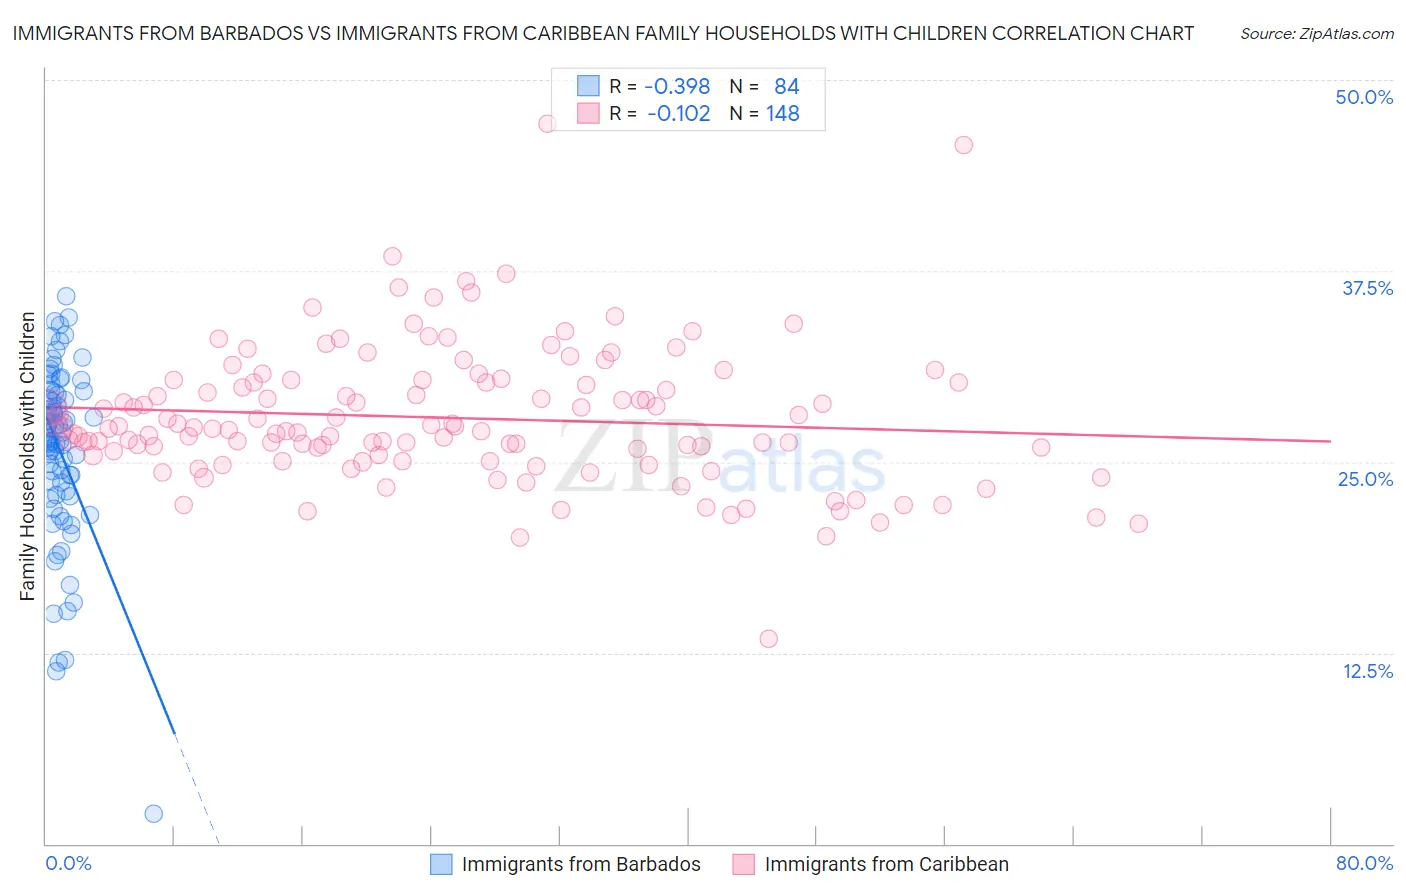
Immigrants from Barbados vs Immigrants from Caribbean Family Households with Children Correlation Chart
The statistical analysis conducted on geographies consisting of 112,760,872 people shows a mild negative correlation between the proportion of Immigrants from Barbados and percentage of family households with children in the United States with a correlation coefficient (R) of -0.398 and weighted average of 26.0%. Similarly, the statistical analysis conducted on geographies consisting of 449,473,851 people shows a poor negative correlation between the proportion of Immigrants from Caribbean and percentage of family households with children in the United States with a correlation coefficient (R) of -0.102 and weighted average of 27.0%, a difference of 4.2%.
Family Households with Children Correlation Summary
| Measurement | Immigrants from Barbados | Immigrants from Caribbean |
| Minimum | 2.0% | 13.4% |
| Maximum | 35.9% | 47.1% |
| Range | 33.9% | 33.7% |
| Mean | 25.7% | 27.9% |
| Median | 26.8% | 27.2% |
| Interquartile 25% (IQ1) | 23.0% | 25.4% |
| Interquartile 75% (IQ3) | 29.5% | 30.2% |
| Interquartile Range (IQR) | 6.5% | 4.8% |
| Standard Deviation (Sample) | 5.9% | 4.5% |
| Standard Deviation (Population) | 5.8% | 4.5% |
Similar Demographics by Family Households with Children
Demographics Similar to Immigrants from Barbados by Family Households with Children
In terms of family households with children, the demographic groups most similar to Immigrants from Barbados are Immigrants from Albania (25.9%, a difference of 0.10%), Immigrants from Ireland (26.0%, a difference of 0.11%), Barbadian (26.0%, a difference of 0.14%), Chinese (26.0%, a difference of 0.19%), and Immigrants from Australia (26.0%, a difference of 0.23%).
| Demographics | Rating | Rank | Family Households with Children |
| Tlingit-Haida | 0.0 /100 | #320 | Tragic 26.0% |
| British West Indians | 0.0 /100 | #321 | Tragic 26.0% |
| Immigrants | Greece | 0.0 /100 | #322 | Tragic 26.0% |
| Immigrants | Australia | 0.0 /100 | #323 | Tragic 26.0% |
| Chinese | 0.0 /100 | #324 | Tragic 26.0% |
| Barbadians | 0.0 /100 | #325 | Tragic 26.0% |
| Immigrants | Ireland | 0.0 /100 | #326 | Tragic 26.0% |
| Immigrants | Barbados | 0.0 /100 | #327 | Tragic 26.0% |
| Immigrants | Albania | 0.0 /100 | #328 | Tragic 25.9% |
| Cypriots | 0.0 /100 | #329 | Tragic 25.9% |
| Immigrants | Latvia | 0.0 /100 | #330 | Tragic 25.9% |
| Slovenes | 0.0 /100 | #331 | Tragic 25.8% |
| Immigrants | Austria | 0.0 /100 | #332 | Tragic 25.8% |
| Immigrants | Switzerland | 0.0 /100 | #333 | Tragic 25.7% |
| Slovaks | 0.0 /100 | #334 | Tragic 25.7% |
Demographics Similar to Immigrants from Caribbean by Family Households with Children
In terms of family households with children, the demographic groups most similar to Immigrants from Caribbean are Czechoslovakian (27.0%, a difference of 0.030%), Tsimshian (27.0%, a difference of 0.030%), Scottish (27.0%, a difference of 0.030%), Bulgarian (27.0%, a difference of 0.050%), and Luxembourger (27.0%, a difference of 0.080%).
| Demographics | Rating | Rank | Family Households with Children |
| Paraguayans | 9.4 /100 | #222 | Tragic 27.1% |
| Pima | 9.2 /100 | #223 | Tragic 27.1% |
| Germans | 8.7 /100 | #224 | Tragic 27.1% |
| Canadians | 7.5 /100 | #225 | Tragic 27.1% |
| Czechoslovakians | 6.6 /100 | #226 | Tragic 27.0% |
| Tsimshian | 6.6 /100 | #227 | Tragic 27.0% |
| Scottish | 6.5 /100 | #228 | Tragic 27.0% |
| Immigrants | Caribbean | 6.3 /100 | #229 | Tragic 27.0% |
| Bulgarians | 5.8 /100 | #230 | Tragic 27.0% |
| Luxembourgers | 5.5 /100 | #231 | Tragic 27.0% |
| Yugoslavians | 5.1 /100 | #232 | Tragic 27.0% |
| Immigrants | Italy | 5.0 /100 | #233 | Tragic 27.0% |
| Immigrants | Germany | 4.4 /100 | #234 | Tragic 27.0% |
| Immigrants | Morocco | 4.2 /100 | #235 | Tragic 27.0% |
| Cape Verdeans | 3.6 /100 | #236 | Tragic 26.9% |