Immigrants from the Azores vs Immigrants from England 9th Grade
COMPARE
Immigrants from the Azores
Immigrants from England
9th Grade
9th Grade Comparison
Immigrants from the Azores
Immigrants from England
90.8%
9TH GRADE
0.0/ 100
METRIC RATING
334th/ 347
METRIC RANK
95.9%
9TH GRADE
99.6/ 100
METRIC RATING
65th/ 347
METRIC RANK
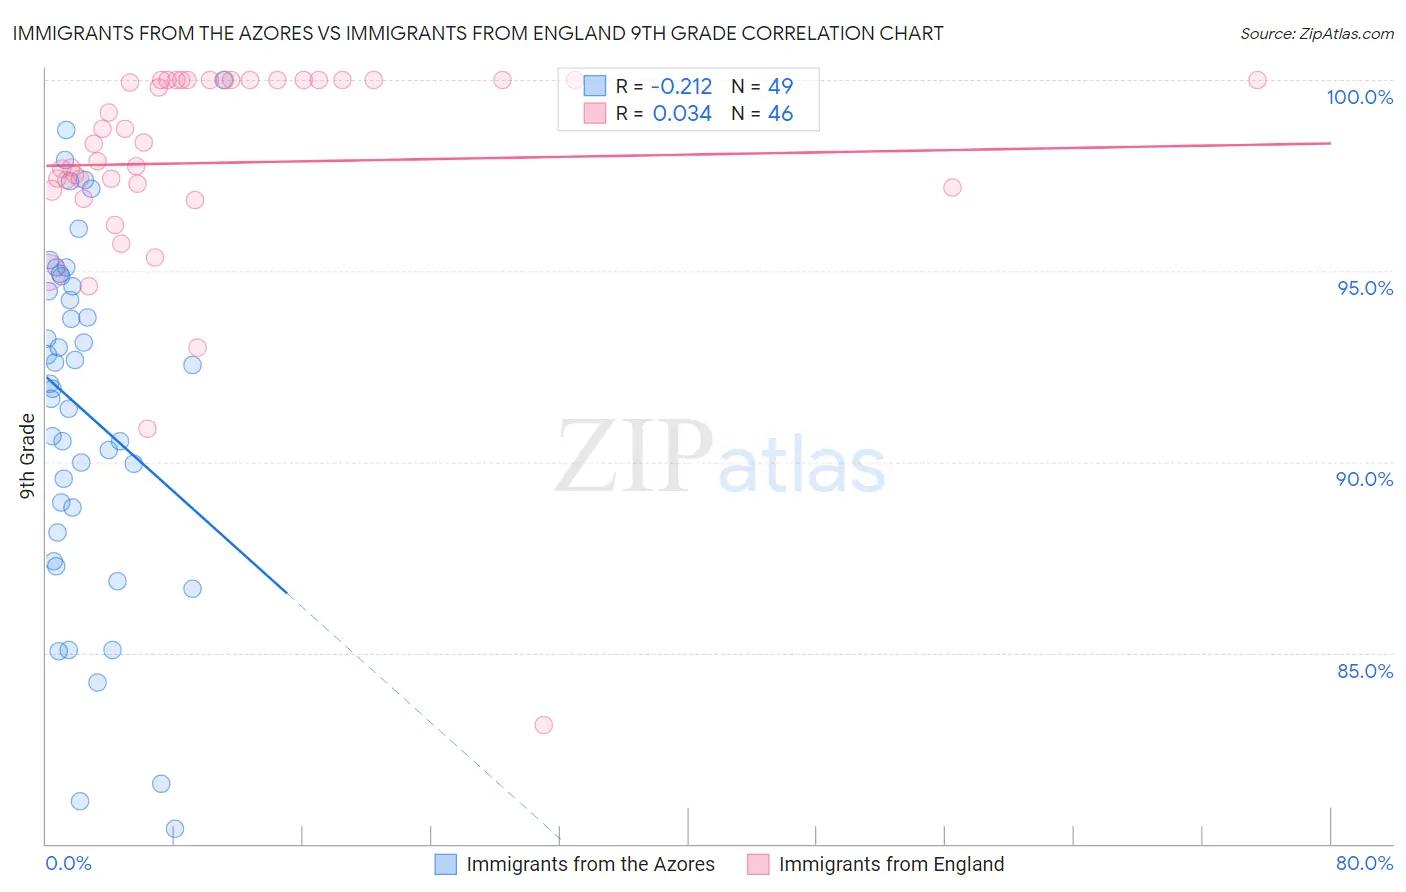
Immigrants from the Azores vs Immigrants from England 9th Grade Correlation Chart
The statistical analysis conducted on geographies consisting of 46,257,310 people shows a weak negative correlation between the proportion of Immigrants from the Azores and percentage of population with at least 9th grade education in the United States with a correlation coefficient (R) of -0.212 and weighted average of 90.8%. Similarly, the statistical analysis conducted on geographies consisting of 391,897,462 people shows no correlation between the proportion of Immigrants from England and percentage of population with at least 9th grade education in the United States with a correlation coefficient (R) of 0.034 and weighted average of 95.9%, a difference of 5.6%.
9th Grade Correlation Summary
| Measurement | Immigrants from the Azores | Immigrants from England |
| Minimum | 80.4% | 83.1% |
| Maximum | 100.0% | 100.0% |
| Range | 19.6% | 16.9% |
| Mean | 91.3% | 97.8% |
| Median | 92.1% | 98.3% |
| Interquartile 25% (IQ1) | 88.5% | 97.2% |
| Interquartile 75% (IQ3) | 94.7% | 100.0% |
| Interquartile Range (IQR) | 6.3% | 2.8% |
| Standard Deviation (Sample) | 4.6% | 3.0% |
| Standard Deviation (Population) | 4.6% | 3.0% |
Similar Demographics by 9th Grade
Demographics Similar to Immigrants from the Azores by 9th Grade
In terms of 9th grade, the demographic groups most similar to Immigrants from the Azores are Immigrants from Yemen (90.8%, a difference of 0.050%), Hispanic or Latino (90.9%, a difference of 0.14%), Mexican American Indian (90.9%, a difference of 0.16%), Immigrants from Honduras (90.6%, a difference of 0.17%), and Immigrants from Cabo Verde (90.9%, a difference of 0.19%).
| Demographics | Rating | Rank | 9th Grade |
| Immigrants | Nicaragua | 0.0 /100 | #327 | Tragic 91.3% |
| Dominicans | 0.0 /100 | #328 | Tragic 91.1% |
| Hondurans | 0.0 /100 | #329 | Tragic 91.0% |
| Immigrants | Cabo Verde | 0.0 /100 | #330 | Tragic 90.9% |
| Mexican American Indians | 0.0 /100 | #331 | Tragic 90.9% |
| Hispanics or Latinos | 0.0 /100 | #332 | Tragic 90.9% |
| Immigrants | Yemen | 0.0 /100 | #333 | Tragic 90.8% |
| Immigrants | Azores | 0.0 /100 | #334 | Tragic 90.8% |
| Immigrants | Honduras | 0.0 /100 | #335 | Tragic 90.6% |
| Immigrants | Dominican Republic | 0.0 /100 | #336 | Tragic 90.5% |
| Immigrants | Latin America | 0.0 /100 | #337 | Tragic 90.4% |
| Central Americans | 0.0 /100 | #338 | Tragic 90.4% |
| Yakama | 0.0 /100 | #339 | Tragic 90.1% |
| Mexicans | 0.0 /100 | #340 | Tragic 90.0% |
| Guatemalans | 0.0 /100 | #341 | Tragic 89.9% |
Demographics Similar to Immigrants from England by 9th Grade
In terms of 9th grade, the demographic groups most similar to Immigrants from England are Zimbabwean (95.9%, a difference of 0.010%), Canadian (95.9%, a difference of 0.020%), Immigrants from Netherlands (95.8%, a difference of 0.020%), Cypriot (95.8%, a difference of 0.020%), and Immigrants from Ireland (95.8%, a difference of 0.030%).
| Demographics | Rating | Rank | 9th Grade |
| Aleuts | 99.8 /100 | #58 | Exceptional 96.0% |
| New Zealanders | 99.8 /100 | #59 | Exceptional 95.9% |
| Native Hawaiians | 99.8 /100 | #60 | Exceptional 95.9% |
| Sioux | 99.8 /100 | #61 | Exceptional 95.9% |
| Ukrainians | 99.7 /100 | #62 | Exceptional 95.9% |
| Canadians | 99.7 /100 | #63 | Exceptional 95.9% |
| Zimbabweans | 99.7 /100 | #64 | Exceptional 95.9% |
| Immigrants | England | 99.6 /100 | #65 | Exceptional 95.9% |
| Immigrants | Netherlands | 99.6 /100 | #66 | Exceptional 95.8% |
| Cypriots | 99.6 /100 | #67 | Exceptional 95.8% |
| Immigrants | Ireland | 99.6 /100 | #68 | Exceptional 95.8% |
| Immigrants | Lithuania | 99.6 /100 | #69 | Exceptional 95.8% |
| Immigrants | Australia | 99.5 /100 | #70 | Exceptional 95.8% |
| Immigrants | Belgium | 99.5 /100 | #71 | Exceptional 95.8% |
| Turks | 99.5 /100 | #72 | Exceptional 95.8% |