Immigrants from Austria vs Immigrants from Western Europe Female Poverty Among 25-34 Year Olds
COMPARE
Immigrants from Austria
Immigrants from Western Europe
Female Poverty Among 25-34 Year Olds
Female Poverty Among 25-34 Year Olds Comparison
Immigrants from Austria
Immigrants from Western Europe
12.5%
FEMALE POVERTY AMONG 25-34 YEAR OLDS
97.4/ 100
METRIC RATING
88th/ 347
METRIC RANK
13.3%
FEMALE POVERTY AMONG 25-34 YEAR OLDS
70.3/ 100
METRIC RATING
157th/ 347
METRIC RANK
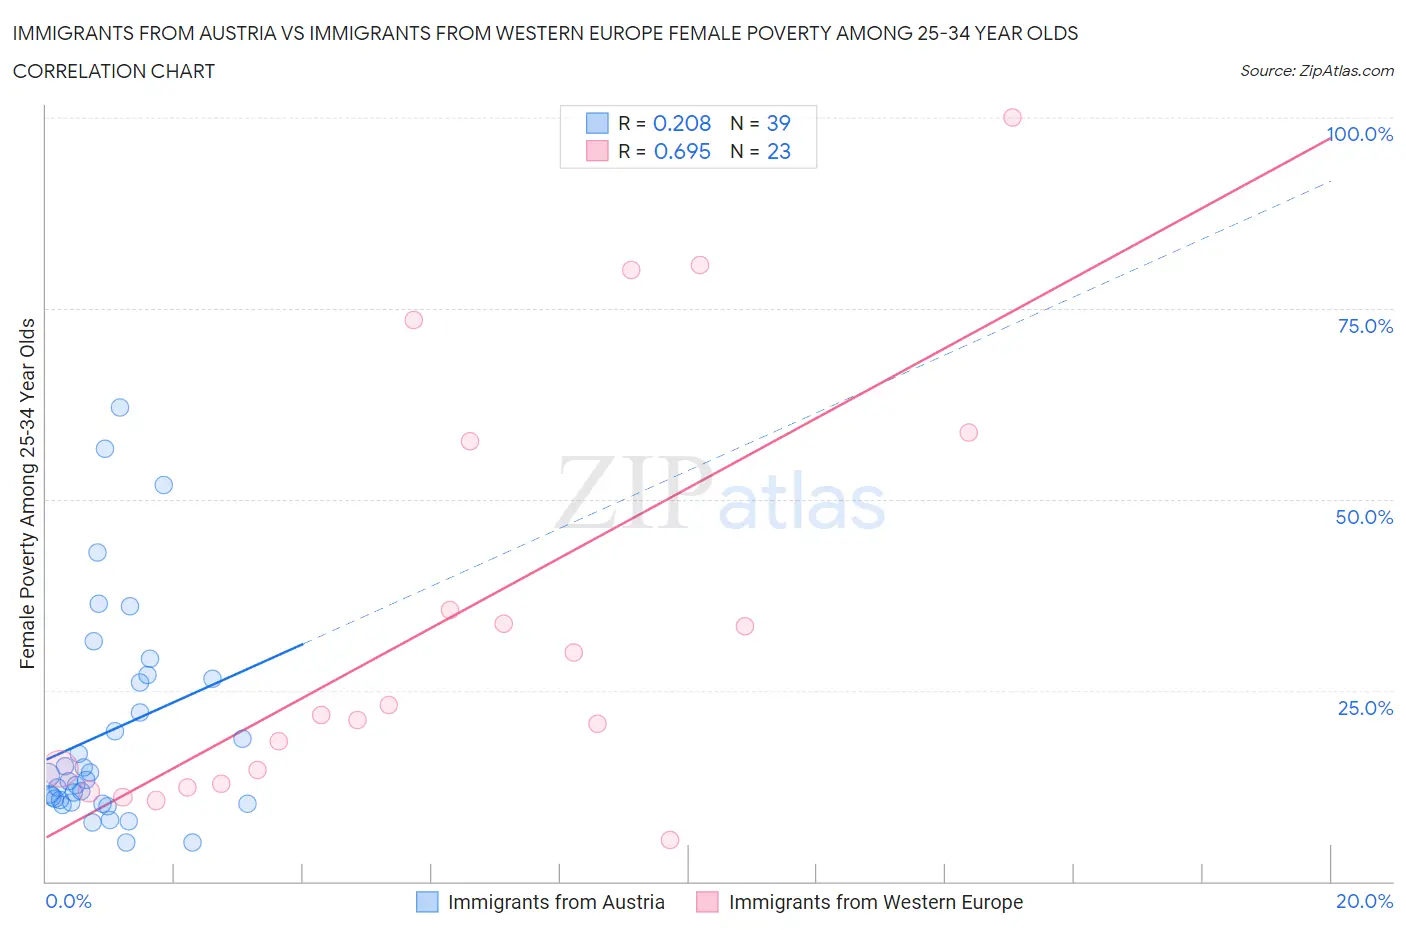
Immigrants from Austria vs Immigrants from Western Europe Female Poverty Among 25-34 Year Olds Correlation Chart
The statistical analysis conducted on geographies consisting of 166,374,239 people shows a weak positive correlation between the proportion of Immigrants from Austria and poverty level among females between the ages 25 and 34 in the United States with a correlation coefficient (R) of 0.208 and weighted average of 12.5%. Similarly, the statistical analysis conducted on geographies consisting of 481,489,982 people shows a significant positive correlation between the proportion of Immigrants from Western Europe and poverty level among females between the ages 25 and 34 in the United States with a correlation coefficient (R) of 0.695 and weighted average of 13.3%, a difference of 6.2%.
Female Poverty Among 25-34 Year Olds Correlation Summary
| Measurement | Immigrants from Austria | Immigrants from Western Europe |
| Minimum | 5.0% | 5.4% |
| Maximum | 62.1% | 100.0% |
| Range | 57.0% | 94.6% |
| Mean | 19.6% | 34.0% |
| Median | 13.3% | 21.8% |
| Interquartile 25% (IQ1) | 10.3% | 12.8% |
| Interquartile 75% (IQ3) | 26.5% | 57.6% |
| Interquartile Range (IQR) | 16.2% | 44.7% |
| Standard Deviation (Sample) | 14.2% | 27.2% |
| Standard Deviation (Population) | 14.1% | 26.6% |
Similar Demographics by Female Poverty Among 25-34 Year Olds
Demographics Similar to Immigrants from Austria by Female Poverty Among 25-34 Year Olds
In terms of female poverty among 25-34 year olds, the demographic groups most similar to Immigrants from Austria are Argentinean (12.5%, a difference of 0.070%), Croatian (12.5%, a difference of 0.10%), Immigrants from South Eastern Asia (12.5%, a difference of 0.11%), Italian (12.5%, a difference of 0.17%), and Immigrants from Latvia (12.5%, a difference of 0.23%).
| Demographics | Rating | Rank | Female Poverty Among 25-34 Year Olds |
| Immigrants | Kazakhstan | 98.1 /100 | #81 | Exceptional 12.4% |
| Ethiopians | 98.0 /100 | #82 | Exceptional 12.4% |
| Albanians | 97.7 /100 | #83 | Exceptional 12.5% |
| Immigrants | Latvia | 97.7 /100 | #84 | Exceptional 12.5% |
| Immigrants | South Eastern Asia | 97.6 /100 | #85 | Exceptional 12.5% |
| Croatians | 97.5 /100 | #86 | Exceptional 12.5% |
| Argentineans | 97.5 /100 | #87 | Exceptional 12.5% |
| Immigrants | Austria | 97.4 /100 | #88 | Exceptional 12.5% |
| Italians | 97.2 /100 | #89 | Exceptional 12.5% |
| Immigrants | Albania | 97.1 /100 | #90 | Exceptional 12.5% |
| Norwegians | 96.9 /100 | #91 | Exceptional 12.6% |
| Immigrants | Armenia | 96.9 /100 | #92 | Exceptional 12.6% |
| Palestinians | 96.9 /100 | #93 | Exceptional 12.6% |
| Immigrants | France | 96.8 /100 | #94 | Exceptional 12.6% |
| Ukrainians | 96.7 /100 | #95 | Exceptional 12.6% |
Demographics Similar to Immigrants from Western Europe by Female Poverty Among 25-34 Year Olds
In terms of female poverty among 25-34 year olds, the demographic groups most similar to Immigrants from Western Europe are Immigrants from Colombia (13.3%, a difference of 0.11%), Immigrants from Cameroon (13.3%, a difference of 0.17%), Immigrants from Sierra Leone (13.3%, a difference of 0.27%), Arab (13.2%, a difference of 0.33%), and Uruguayan (13.3%, a difference of 0.33%).
| Demographics | Rating | Rank | Female Poverty Among 25-34 Year Olds |
| Iraqis | 76.0 /100 | #150 | Good 13.2% |
| Costa Ricans | 75.8 /100 | #151 | Good 13.2% |
| Slavs | 75.7 /100 | #152 | Good 13.2% |
| Northern Europeans | 73.7 /100 | #153 | Good 13.2% |
| Arabs | 73.5 /100 | #154 | Good 13.2% |
| Immigrants | Sierra Leone | 72.9 /100 | #155 | Good 13.3% |
| Immigrants | Cameroon | 72.0 /100 | #156 | Good 13.3% |
| Immigrants | Western Europe | 70.3 /100 | #157 | Good 13.3% |
| Immigrants | Colombia | 69.2 /100 | #158 | Good 13.3% |
| Uruguayans | 66.9 /100 | #159 | Good 13.3% |
| Immigrants | South America | 66.3 /100 | #160 | Good 13.3% |
| Icelanders | 65.7 /100 | #161 | Good 13.3% |
| Ugandans | 64.1 /100 | #162 | Good 13.4% |
| British | 63.5 /100 | #163 | Good 13.4% |
| Swiss | 61.7 /100 | #164 | Good 13.4% |