Immigrants from Austria vs Indian (Asian) Single Mother Households
COMPARE
Immigrants from Austria
Indian (Asian)
Single Mother Households
Single Mother Households Comparison
Immigrants from Austria
Indians (Asian)
5.2%
SINGLE MOTHER HOUSEHOLDS
99.8/ 100
METRIC RATING
23rd/ 347
METRIC RANK
5.1%
SINGLE MOTHER HOUSEHOLDS
99.9/ 100
METRIC RATING
16th/ 347
METRIC RANK
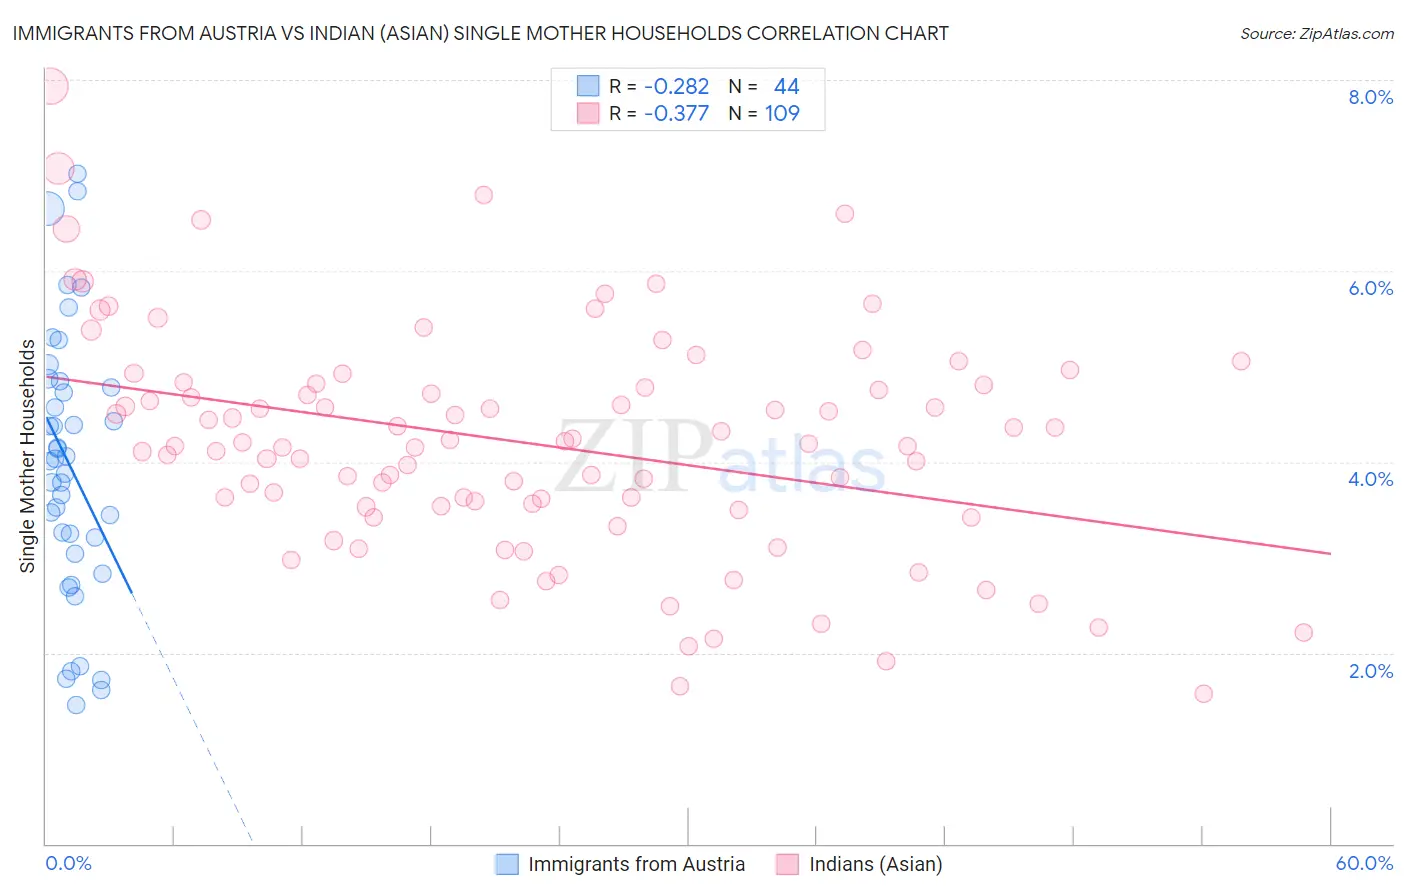
Immigrants from Austria vs Indian (Asian) Single Mother Households Correlation Chart
The statistical analysis conducted on geographies consisting of 167,548,471 people shows a weak negative correlation between the proportion of Immigrants from Austria and percentage of single mother households in the United States with a correlation coefficient (R) of -0.282 and weighted average of 5.2%. Similarly, the statistical analysis conducted on geographies consisting of 492,899,997 people shows a mild negative correlation between the proportion of Indians (Asian) and percentage of single mother households in the United States with a correlation coefficient (R) of -0.377 and weighted average of 5.1%, a difference of 2.4%.
Single Mother Households Correlation Summary
| Measurement | Immigrants from Austria | Indian (Asian) |
| Minimum | 1.5% | 1.6% |
| Maximum | 7.0% | 7.9% |
| Range | 5.6% | 6.4% |
| Mean | 4.0% | 4.2% |
| Median | 4.0% | 4.2% |
| Interquartile 25% (IQ1) | 3.1% | 3.5% |
| Interquartile 75% (IQ3) | 4.8% | 4.8% |
| Interquartile Range (IQR) | 1.7% | 1.3% |
| Standard Deviation (Sample) | 1.4% | 1.2% |
| Standard Deviation (Population) | 1.4% | 1.2% |
Demographics Similar to Immigrants from Austria and Indians (Asian) by Single Mother Households
In terms of single mother households, the demographic groups most similar to Immigrants from Austria are Thai (5.2%, a difference of 0.050%), Armenian (5.2%, a difference of 0.060%), Immigrants from Japan (5.2%, a difference of 0.39%), Immigrants from Lithuania (5.3%, a difference of 0.42%), and Eastern European (5.2%, a difference of 0.77%). Similarly, the demographic groups most similar to Indians (Asian) are Immigrants from Eastern Asia (5.1%, a difference of 0.19%), Soviet Union (5.1%, a difference of 0.21%), Immigrants from Australia (5.1%, a difference of 0.28%), Immigrants from India (5.1%, a difference of 0.60%), and Cypriot (5.1%, a difference of 0.73%).
| Demographics | Rating | Rank | Single Mother Households |
| Okinawans | 99.9 /100 | #9 | Exceptional 5.0% |
| Immigrants | Israel | 99.9 /100 | #10 | Exceptional 5.0% |
| Immigrants | China | 99.9 /100 | #11 | Exceptional 5.1% |
| Cypriots | 99.9 /100 | #12 | Exceptional 5.1% |
| Immigrants | India | 99.9 /100 | #13 | Exceptional 5.1% |
| Immigrants | Australia | 99.9 /100 | #14 | Exceptional 5.1% |
| Immigrants | Eastern Asia | 99.9 /100 | #15 | Exceptional 5.1% |
| Indians (Asian) | 99.9 /100 | #16 | Exceptional 5.1% |
| Soviet Union | 99.9 /100 | #17 | Exceptional 5.1% |
| Immigrants | Armenia | 99.9 /100 | #18 | Exceptional 5.2% |
| Chinese | 99.9 /100 | #19 | Exceptional 5.2% |
| Maltese | 99.9 /100 | #20 | Exceptional 5.2% |
| Eastern Europeans | 99.8 /100 | #21 | Exceptional 5.2% |
| Thais | 99.8 /100 | #22 | Exceptional 5.2% |
| Immigrants | Austria | 99.8 /100 | #23 | Exceptional 5.2% |
| Armenians | 99.8 /100 | #24 | Exceptional 5.2% |
| Immigrants | Japan | 99.8 /100 | #25 | Exceptional 5.2% |
| Immigrants | Lithuania | 99.8 /100 | #26 | Exceptional 5.3% |
| Bhutanese | 99.7 /100 | #27 | Exceptional 5.3% |
| Russians | 99.7 /100 | #28 | Exceptional 5.3% |
| Latvians | 99.7 /100 | #29 | Exceptional 5.3% |