Immigrants from Australia vs Immigrants from Uruguay Currently Married
COMPARE
Immigrants from Australia
Immigrants from Uruguay
Currently Married
Currently Married Comparison
Immigrants from Australia
Immigrants from Uruguay
47.3%
CURRENTLY MARRIED
81.1/ 100
METRIC RATING
134th/ 347
METRIC RANK
45.0%
CURRENTLY MARRIED
2.0/ 100
METRIC RATING
228th/ 347
METRIC RANK
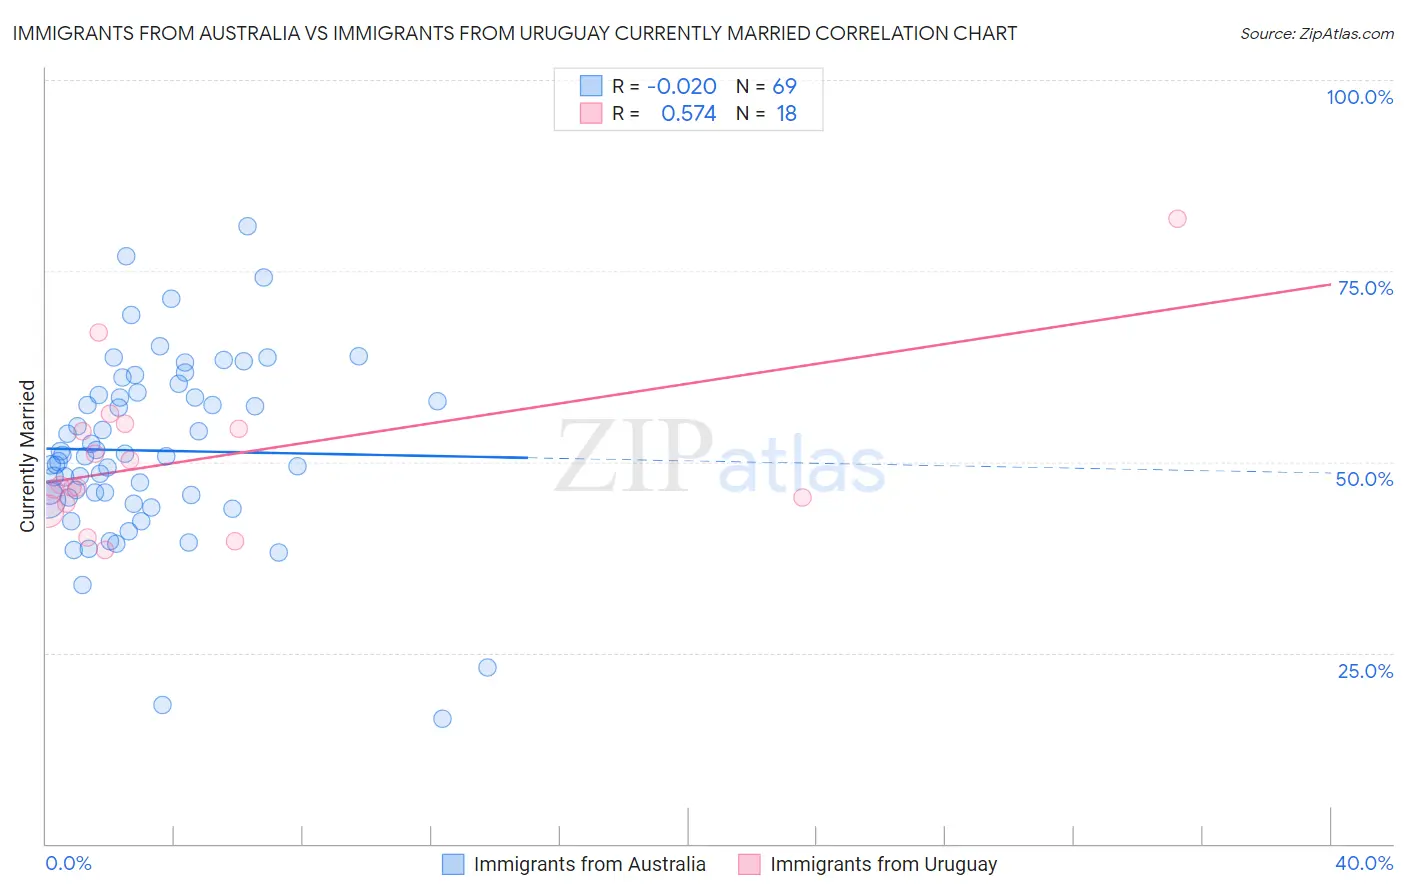
Immigrants from Australia vs Immigrants from Uruguay Currently Married Correlation Chart
The statistical analysis conducted on geographies consisting of 227,193,510 people shows no correlation between the proportion of Immigrants from Australia and percentage of population currently married in the United States with a correlation coefficient (R) of -0.020 and weighted average of 47.3%. Similarly, the statistical analysis conducted on geographies consisting of 133,250,872 people shows a substantial positive correlation between the proportion of Immigrants from Uruguay and percentage of population currently married in the United States with a correlation coefficient (R) of 0.574 and weighted average of 45.0%, a difference of 5.1%.
Currently Married Correlation Summary
| Measurement | Immigrants from Australia | Immigrants from Uruguay |
| Minimum | 16.4% | 38.5% |
| Maximum | 80.8% | 81.8% |
| Range | 64.4% | 43.3% |
| Mean | 51.5% | 50.5% |
| Median | 50.7% | 46.8% |
| Interquartile 25% (IQ1) | 45.2% | 44.5% |
| Interquartile 75% (IQ3) | 58.9% | 54.4% |
| Interquartile Range (IQR) | 13.7% | 9.9% |
| Standard Deviation (Sample) | 12.0% | 10.5% |
| Standard Deviation (Population) | 11.9% | 10.2% |
Similar Demographics by Currently Married
Demographics Similar to Immigrants from Australia by Currently Married
In terms of currently married, the demographic groups most similar to Immigrants from Australia are Immigrants from Malaysia (47.3%, a difference of 0.0%), Afghan (47.3%, a difference of 0.050%), Icelander (47.3%, a difference of 0.080%), Immigrants from Norway (47.2%, a difference of 0.080%), and Immigrants from Iraq (47.3%, a difference of 0.11%).
| Demographics | Rating | Rank | Currently Married |
| New Zealanders | 84.9 /100 | #127 | Excellent 47.4% |
| Portuguese | 84.2 /100 | #128 | Excellent 47.3% |
| Sri Lankans | 83.2 /100 | #129 | Excellent 47.3% |
| Immigrants | Iraq | 82.8 /100 | #130 | Excellent 47.3% |
| Icelanders | 82.4 /100 | #131 | Excellent 47.3% |
| Afghans | 81.8 /100 | #132 | Excellent 47.3% |
| Immigrants | Malaysia | 81.1 /100 | #133 | Excellent 47.3% |
| Immigrants | Australia | 81.1 /100 | #134 | Excellent 47.3% |
| Immigrants | Norway | 79.7 /100 | #135 | Good 47.2% |
| Immigrants | Vietnam | 78.2 /100 | #136 | Good 47.2% |
| Paraguayans | 77.8 /100 | #137 | Good 47.2% |
| Pakistanis | 77.5 /100 | #138 | Good 47.2% |
| Yugoslavians | 77.4 /100 | #139 | Good 47.2% |
| Cajuns | 75.3 /100 | #140 | Good 47.1% |
| Venezuelans | 74.4 /100 | #141 | Good 47.1% |
Demographics Similar to Immigrants from Uruguay by Currently Married
In terms of currently married, the demographic groups most similar to Immigrants from Uruguay are Spanish American (45.0%, a difference of 0.0%), Comanche (45.0%, a difference of 0.010%), Immigrants from Uganda (45.0%, a difference of 0.060%), French American Indian (45.0%, a difference of 0.060%), and Immigrants from Laos (45.0%, a difference of 0.11%).
| Demographics | Rating | Rank | Currently Married |
| Mexicans | 3.0 /100 | #221 | Tragic 45.2% |
| Immigrants | Azores | 2.5 /100 | #222 | Tragic 45.1% |
| Immigrants | Laos | 2.3 /100 | #223 | Tragic 45.0% |
| Immigrants | Uganda | 2.2 /100 | #224 | Tragic 45.0% |
| French American Indians | 2.2 /100 | #225 | Tragic 45.0% |
| Comanche | 2.1 /100 | #226 | Tragic 45.0% |
| Spanish Americans | 2.1 /100 | #227 | Tragic 45.0% |
| Immigrants | Uruguay | 2.0 /100 | #228 | Tragic 45.0% |
| Cree | 1.7 /100 | #229 | Tragic 44.9% |
| Immigrants | Kenya | 1.6 /100 | #230 | Tragic 44.9% |
| Immigrants | Panama | 1.5 /100 | #231 | Tragic 44.9% |
| Nepalese | 1.2 /100 | #232 | Tragic 44.7% |
| Immigrants | Saudi Arabia | 1.1 /100 | #233 | Tragic 44.7% |
| Iroquois | 1.1 /100 | #234 | Tragic 44.7% |
| Alaskan Athabascans | 0.9 /100 | #235 | Tragic 44.6% |