Immigrants from Australia vs Immigrants from Morocco Currently Married
COMPARE
Immigrants from Australia
Immigrants from Morocco
Currently Married
Currently Married Comparison
Immigrants from Australia
Immigrants from Morocco
47.3%
CURRENTLY MARRIED
81.1/ 100
METRIC RATING
134th/ 347
METRIC RANK
45.4%
CURRENTLY MARRIED
5.5/ 100
METRIC RATING
216th/ 347
METRIC RANK
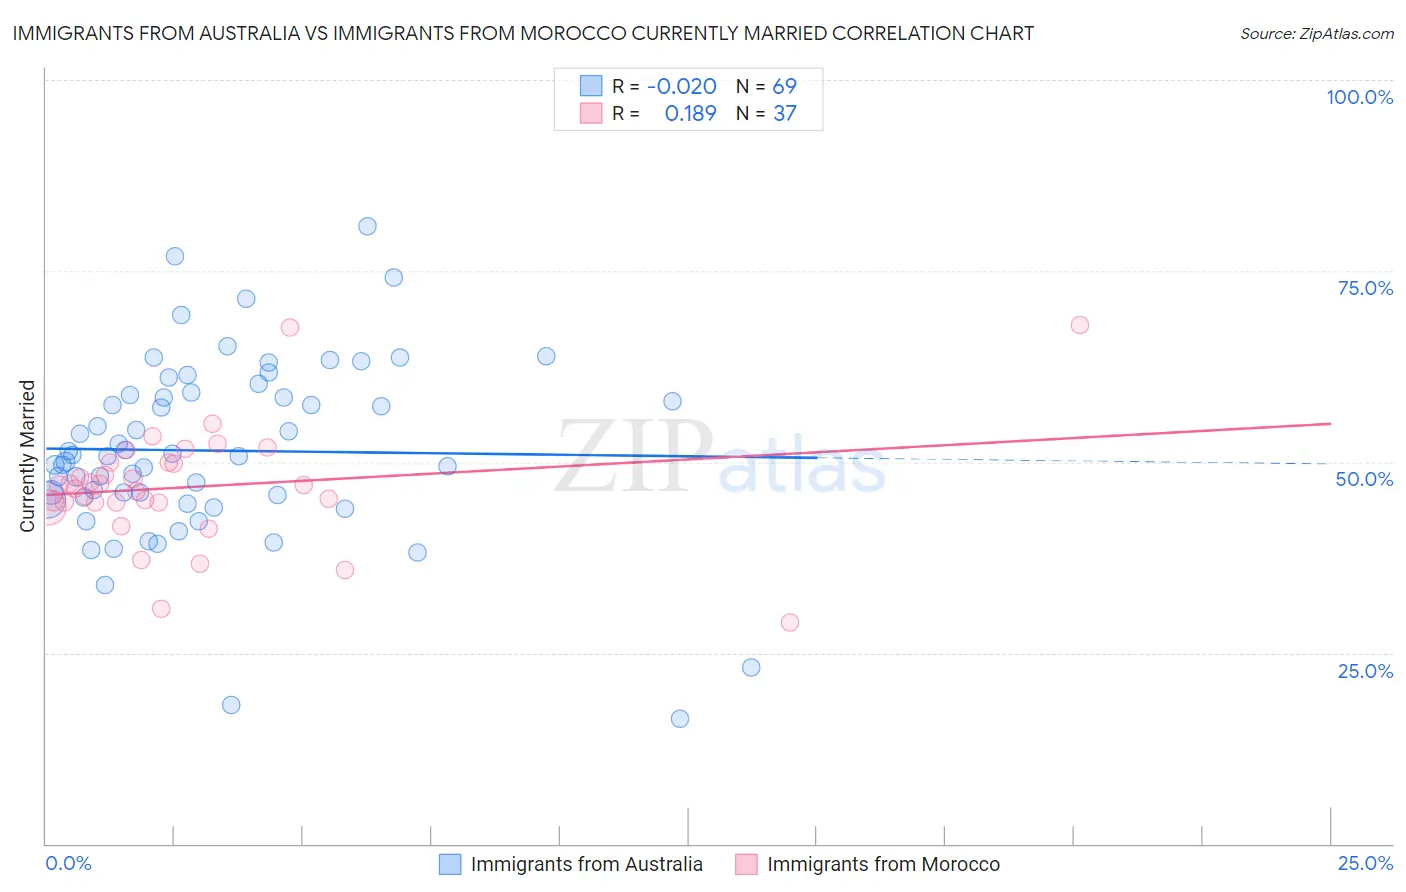
Immigrants from Australia vs Immigrants from Morocco Currently Married Correlation Chart
The statistical analysis conducted on geographies consisting of 227,193,510 people shows no correlation between the proportion of Immigrants from Australia and percentage of population currently married in the United States with a correlation coefficient (R) of -0.020 and weighted average of 47.3%. Similarly, the statistical analysis conducted on geographies consisting of 178,912,438 people shows a poor positive correlation between the proportion of Immigrants from Morocco and percentage of population currently married in the United States with a correlation coefficient (R) of 0.189 and weighted average of 45.4%, a difference of 4.0%.
Currently Married Correlation Summary
| Measurement | Immigrants from Australia | Immigrants from Morocco |
| Minimum | 16.4% | 29.0% |
| Maximum | 80.8% | 67.9% |
| Range | 64.4% | 38.9% |
| Mean | 51.5% | 46.7% |
| Median | 50.7% | 46.9% |
| Interquartile 25% (IQ1) | 45.2% | 44.6% |
| Interquartile 75% (IQ3) | 58.9% | 49.9% |
| Interquartile Range (IQR) | 13.7% | 5.3% |
| Standard Deviation (Sample) | 12.0% | 7.6% |
| Standard Deviation (Population) | 11.9% | 7.5% |
Similar Demographics by Currently Married
Demographics Similar to Immigrants from Australia by Currently Married
In terms of currently married, the demographic groups most similar to Immigrants from Australia are Immigrants from Malaysia (47.3%, a difference of 0.0%), Afghan (47.3%, a difference of 0.050%), Icelander (47.3%, a difference of 0.080%), Immigrants from Norway (47.2%, a difference of 0.080%), and Immigrants from Iraq (47.3%, a difference of 0.11%).
| Demographics | Rating | Rank | Currently Married |
| New Zealanders | 84.9 /100 | #127 | Excellent 47.4% |
| Portuguese | 84.2 /100 | #128 | Excellent 47.3% |
| Sri Lankans | 83.2 /100 | #129 | Excellent 47.3% |
| Immigrants | Iraq | 82.8 /100 | #130 | Excellent 47.3% |
| Icelanders | 82.4 /100 | #131 | Excellent 47.3% |
| Afghans | 81.8 /100 | #132 | Excellent 47.3% |
| Immigrants | Malaysia | 81.1 /100 | #133 | Excellent 47.3% |
| Immigrants | Australia | 81.1 /100 | #134 | Excellent 47.3% |
| Immigrants | Norway | 79.7 /100 | #135 | Good 47.2% |
| Immigrants | Vietnam | 78.2 /100 | #136 | Good 47.2% |
| Paraguayans | 77.8 /100 | #137 | Good 47.2% |
| Pakistanis | 77.5 /100 | #138 | Good 47.2% |
| Yugoslavians | 77.4 /100 | #139 | Good 47.2% |
| Cajuns | 75.3 /100 | #140 | Good 47.1% |
| Venezuelans | 74.4 /100 | #141 | Good 47.1% |
Demographics Similar to Immigrants from Morocco by Currently Married
In terms of currently married, the demographic groups most similar to Immigrants from Morocco are Immigrants from Thailand (45.4%, a difference of 0.080%), Dutch West Indian (45.5%, a difference of 0.20%), German Russian (45.5%, a difference of 0.20%), Alaska Native (45.5%, a difference of 0.24%), and Houma (45.5%, a difference of 0.27%).
| Demographics | Rating | Rank | Currently Married |
| Immigrants | Micronesia | 8.8 /100 | #209 | Tragic 45.6% |
| Uruguayans | 7.9 /100 | #210 | Tragic 45.6% |
| Houma | 7.2 /100 | #211 | Tragic 45.5% |
| Marshallese | 7.2 /100 | #212 | Tragic 45.5% |
| Alaska Natives | 7.0 /100 | #213 | Tragic 45.5% |
| Dutch West Indians | 6.7 /100 | #214 | Tragic 45.5% |
| German Russians | 6.7 /100 | #215 | Tragic 45.5% |
| Immigrants | Morocco | 5.5 /100 | #216 | Tragic 45.4% |
| Immigrants | Thailand | 5.1 /100 | #217 | Tragic 45.4% |
| Panamanians | 4.0 /100 | #218 | Tragic 45.3% |
| Immigrants | Portugal | 3.5 /100 | #219 | Tragic 45.2% |
| Kenyans | 3.1 /100 | #220 | Tragic 45.2% |
| Mexicans | 3.0 /100 | #221 | Tragic 45.2% |
| Immigrants | Azores | 2.5 /100 | #222 | Tragic 45.1% |
| Immigrants | Laos | 2.3 /100 | #223 | Tragic 45.0% |