Immigrants from Asia vs Costa Rican Family Households
COMPARE
Immigrants from Asia
Costa Rican
Family Households
Family Households Comparison
Immigrants from Asia
Costa Ricans
66.1%
FAMILY HOUSEHOLDS
100.0/ 100
METRIC RATING
58th/ 347
METRIC RANK
65.9%
FAMILY HOUSEHOLDS
99.9/ 100
METRIC RATING
65th/ 347
METRIC RANK
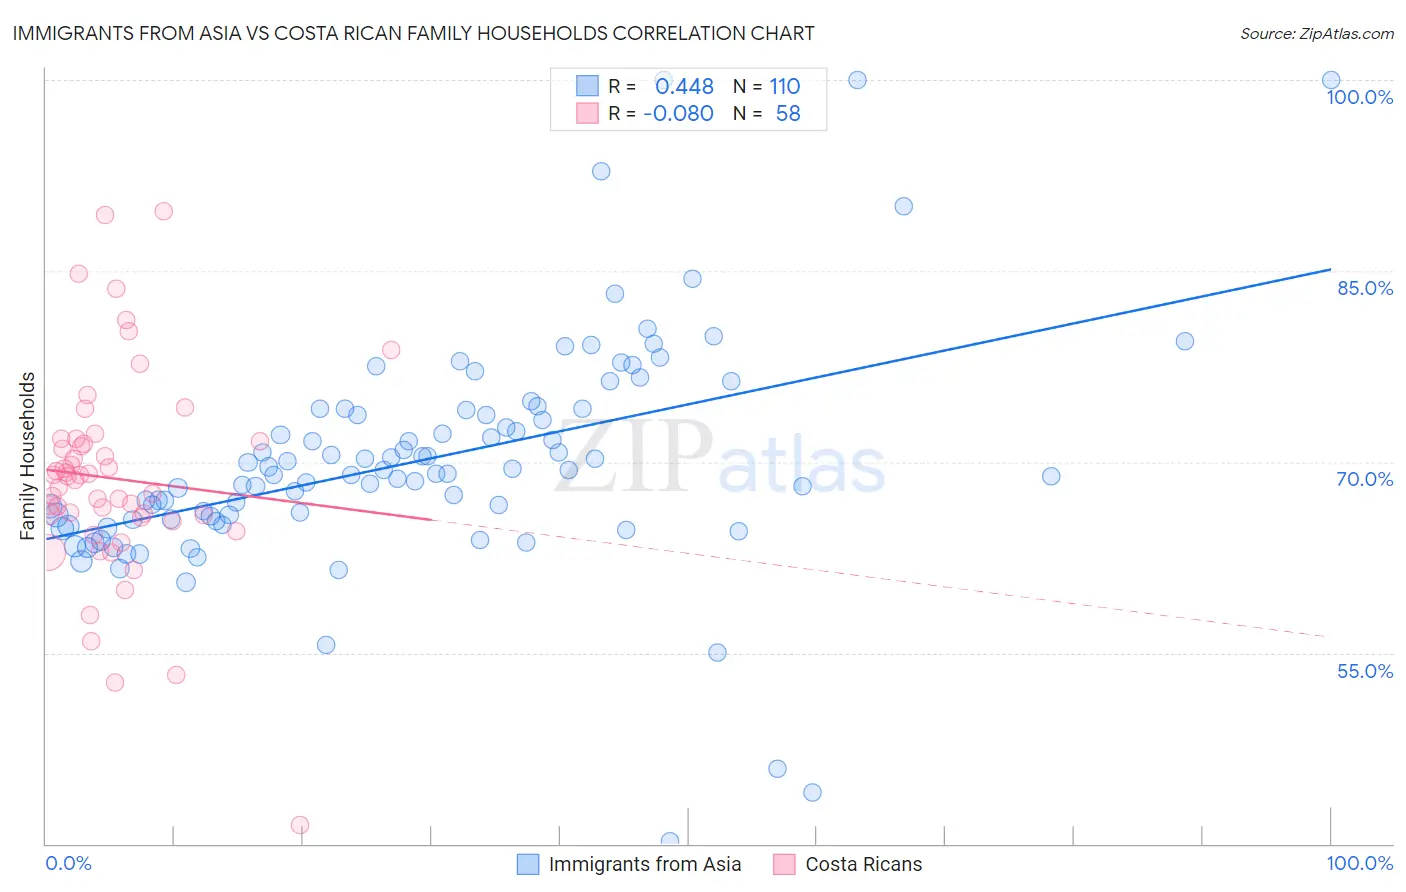
Immigrants from Asia vs Costa Rican Family Households Correlation Chart
The statistical analysis conducted on geographies consisting of 548,543,678 people shows a moderate positive correlation between the proportion of Immigrants from Asia and percentage of family households in the United States with a correlation coefficient (R) of 0.448 and weighted average of 66.1%. Similarly, the statistical analysis conducted on geographies consisting of 253,469,677 people shows a slight negative correlation between the proportion of Costa Ricans and percentage of family households in the United States with a correlation coefficient (R) of -0.080 and weighted average of 65.9%, a difference of 0.19%.
Family Households Correlation Summary
| Measurement | Immigrants from Asia | Costa Rican |
| Minimum | 40.2% | 41.4% |
| Maximum | 100.0% | 89.7% |
| Range | 59.8% | 48.2% |
| Mean | 70.1% | 68.7% |
| Median | 69.0% | 68.7% |
| Interquartile 25% (IQ1) | 65.5% | 65.6% |
| Interquartile 75% (IQ3) | 74.1% | 71.6% |
| Interquartile Range (IQR) | 8.6% | 6.0% |
| Standard Deviation (Sample) | 9.1% | 8.2% |
| Standard Deviation (Population) | 9.1% | 8.2% |
Demographics Similar to Immigrants from Asia and Costa Ricans by Family Households
In terms of family households, the demographic groups most similar to Immigrants from Asia are Immigrants from Korea (66.0%, a difference of 0.020%), South American (66.0%, a difference of 0.030%), Danish (66.0%, a difference of 0.050%), Central American (66.0%, a difference of 0.080%), and Pennsylvania German (66.1%, a difference of 0.11%). Similarly, the demographic groups most similar to Costa Ricans are Pima (65.9%, a difference of 0.010%), Fijian (65.9%, a difference of 0.040%), Filipino (65.9%, a difference of 0.040%), Japanese (65.9%, a difference of 0.060%), and Immigrants from Indonesia (66.0%, a difference of 0.070%).
| Demographics | Rating | Rank | Family Households |
| Natives/Alaskans | 100.0 /100 | #51 | Exceptional 66.4% |
| Colombians | 100.0 /100 | #52 | Exceptional 66.3% |
| Afghans | 100.0 /100 | #53 | Exceptional 66.3% |
| Immigrants | Colombia | 100.0 /100 | #54 | Exceptional 66.3% |
| Immigrants | Immigrants | 100.0 /100 | #55 | Exceptional 66.1% |
| Immigrants | Hong Kong | 100.0 /100 | #56 | Exceptional 66.1% |
| Pennsylvania Germans | 100.0 /100 | #57 | Exceptional 66.1% |
| Immigrants | Asia | 100.0 /100 | #58 | Exceptional 66.1% |
| Immigrants | Korea | 100.0 /100 | #59 | Exceptional 66.0% |
| South Americans | 100.0 /100 | #60 | Exceptional 66.0% |
| Danes | 100.0 /100 | #61 | Exceptional 66.0% |
| Central Americans | 100.0 /100 | #62 | Exceptional 66.0% |
| Immigrants | Indonesia | 100.0 /100 | #63 | Exceptional 66.0% |
| Pima | 99.9 /100 | #64 | Exceptional 65.9% |
| Costa Ricans | 99.9 /100 | #65 | Exceptional 65.9% |
| Fijians | 99.9 /100 | #66 | Exceptional 65.9% |
| Filipinos | 99.9 /100 | #67 | Exceptional 65.9% |
| Japanese | 99.9 /100 | #68 | Exceptional 65.9% |
| Malaysians | 99.9 /100 | #69 | Exceptional 65.9% |
| Immigrants | Afghanistan | 99.9 /100 | #70 | Exceptional 65.9% |
| Bhutanese | 99.9 /100 | #71 | Exceptional 65.9% |