Immigrants from Asia vs White/Caucasian Family Households
COMPARE
Immigrants from Asia
White/Caucasian
Family Households
Family Households Comparison
Immigrants from Asia
Whites/Caucasians
66.1%
FAMILY HOUSEHOLDS
100.0/ 100
METRIC RATING
58th/ 347
METRIC RANK
65.1%
FAMILY HOUSEHOLDS
97.3/ 100
METRIC RATING
106th/ 347
METRIC RANK
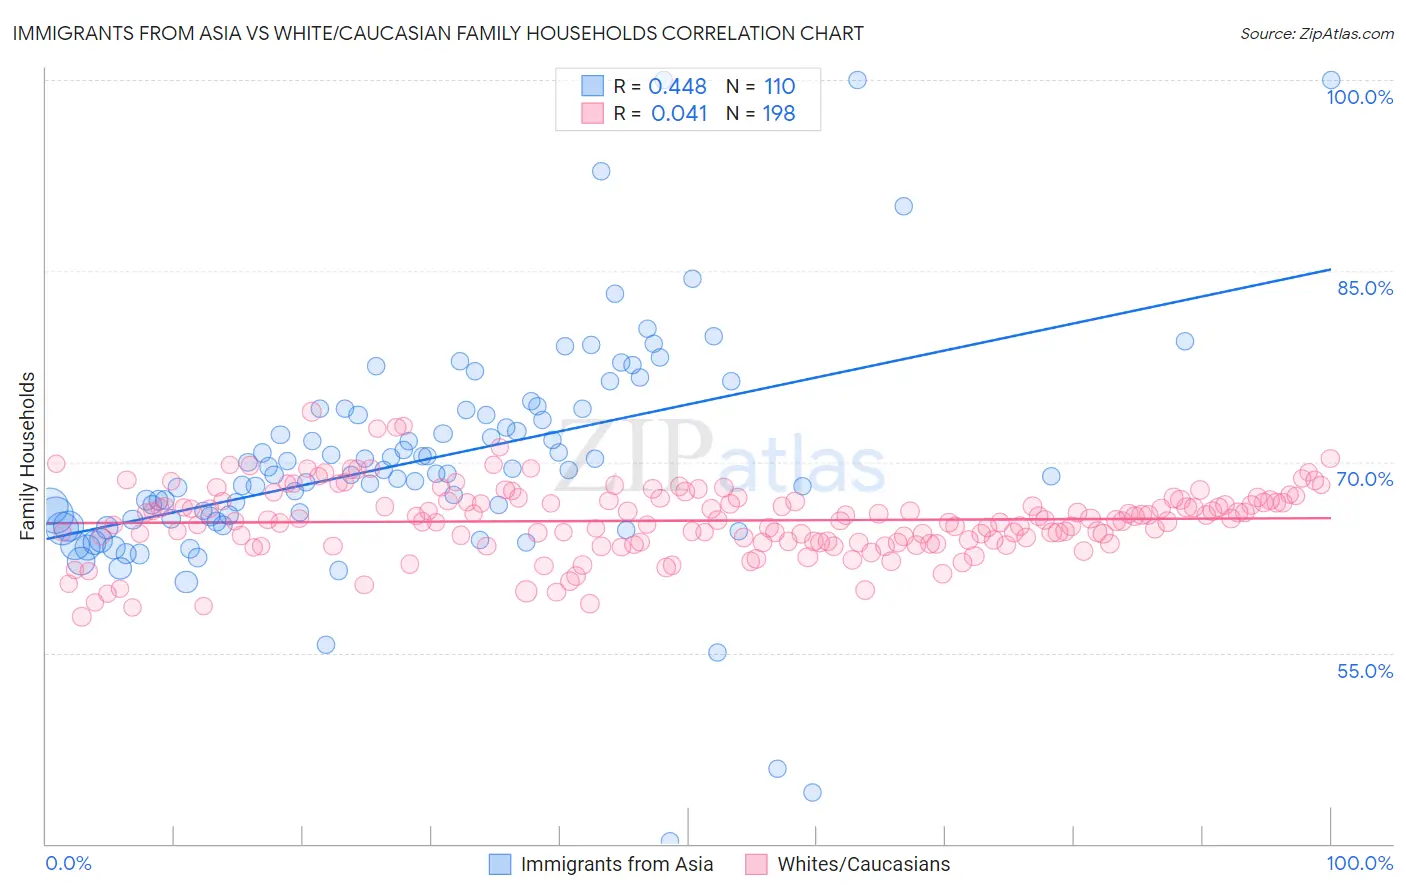
Immigrants from Asia vs White/Caucasian Family Households Correlation Chart
The statistical analysis conducted on geographies consisting of 548,543,678 people shows a moderate positive correlation between the proportion of Immigrants from Asia and percentage of family households in the United States with a correlation coefficient (R) of 0.448 and weighted average of 66.1%. Similarly, the statistical analysis conducted on geographies consisting of 583,404,085 people shows no correlation between the proportion of Whites/Caucasians and percentage of family households in the United States with a correlation coefficient (R) of 0.041 and weighted average of 65.1%, a difference of 1.5%.
Family Households Correlation Summary
| Measurement | Immigrants from Asia | White/Caucasian |
| Minimum | 40.2% | 57.8% |
| Maximum | 100.0% | 73.9% |
| Range | 59.8% | 16.1% |
| Mean | 70.1% | 65.4% |
| Median | 69.0% | 65.4% |
| Interquartile 25% (IQ1) | 65.5% | 63.7% |
| Interquartile 75% (IQ3) | 74.1% | 66.9% |
| Interquartile Range (IQR) | 8.6% | 3.2% |
| Standard Deviation (Sample) | 9.1% | 2.8% |
| Standard Deviation (Population) | 9.1% | 2.8% |
Similar Demographics by Family Households
Demographics Similar to Immigrants from Asia by Family Households
In terms of family households, the demographic groups most similar to Immigrants from Asia are Immigrants from Korea (66.0%, a difference of 0.020%), South American (66.0%, a difference of 0.030%), Danish (66.0%, a difference of 0.050%), Central American (66.0%, a difference of 0.080%), and Pennsylvania German (66.1%, a difference of 0.11%).
| Demographics | Rating | Rank | Family Households |
| Natives/Alaskans | 100.0 /100 | #51 | Exceptional 66.4% |
| Colombians | 100.0 /100 | #52 | Exceptional 66.3% |
| Afghans | 100.0 /100 | #53 | Exceptional 66.3% |
| Immigrants | Colombia | 100.0 /100 | #54 | Exceptional 66.3% |
| Immigrants | Immigrants | 100.0 /100 | #55 | Exceptional 66.1% |
| Immigrants | Hong Kong | 100.0 /100 | #56 | Exceptional 66.1% |
| Pennsylvania Germans | 100.0 /100 | #57 | Exceptional 66.1% |
| Immigrants | Asia | 100.0 /100 | #58 | Exceptional 66.1% |
| Immigrants | Korea | 100.0 /100 | #59 | Exceptional 66.0% |
| South Americans | 100.0 /100 | #60 | Exceptional 66.0% |
| Danes | 100.0 /100 | #61 | Exceptional 66.0% |
| Central Americans | 100.0 /100 | #62 | Exceptional 66.0% |
| Immigrants | Indonesia | 100.0 /100 | #63 | Exceptional 66.0% |
| Pima | 99.9 /100 | #64 | Exceptional 65.9% |
| Costa Ricans | 99.9 /100 | #65 | Exceptional 65.9% |
Demographics Similar to Whites/Caucasians by Family Households
In terms of family households, the demographic groups most similar to Whites/Caucasians are Alaska Native (65.1%, a difference of 0.0%), English (65.1%, a difference of 0.010%), Palestinian (65.1%, a difference of 0.010%), Immigrants from Guatemala (65.0%, a difference of 0.050%), and Scandinavian (65.0%, a difference of 0.060%).
| Demographics | Rating | Rank | Family Households |
| Central American Indians | 98.3 /100 | #99 | Exceptional 65.2% |
| Haitians | 98.1 /100 | #100 | Exceptional 65.2% |
| Chileans | 98.1 /100 | #101 | Exceptional 65.2% |
| Immigrants | Sri Lanka | 98.0 /100 | #102 | Exceptional 65.1% |
| Indians (Asian) | 97.9 /100 | #103 | Exceptional 65.1% |
| Spaniards | 97.8 /100 | #104 | Exceptional 65.1% |
| English | 97.4 /100 | #105 | Exceptional 65.1% |
| Whites/Caucasians | 97.3 /100 | #106 | Exceptional 65.1% |
| Alaska Natives | 97.3 /100 | #107 | Exceptional 65.1% |
| Palestinians | 97.2 /100 | #108 | Exceptional 65.1% |
| Immigrants | Guatemala | 96.9 /100 | #109 | Exceptional 65.0% |
| Scandinavians | 96.8 /100 | #110 | Exceptional 65.0% |
| Europeans | 96.8 /100 | #111 | Exceptional 65.0% |
| Immigrants | Jordan | 96.5 /100 | #112 | Exceptional 65.0% |
| Spanish | 96.2 /100 | #113 | Exceptional 65.0% |