Immigrants from Argentina vs Immigrants from Kenya Single Mother Households
COMPARE
Immigrants from Argentina
Immigrants from Kenya
Single Mother Households
Single Mother Households Comparison
Immigrants from Argentina
Immigrants from Kenya
5.9%
SINGLE MOTHER HOUSEHOLDS
93.2/ 100
METRIC RATING
124th/ 347
METRIC RANK
7.0%
SINGLE MOTHER HOUSEHOLDS
2.1/ 100
METRIC RATING
229th/ 347
METRIC RANK
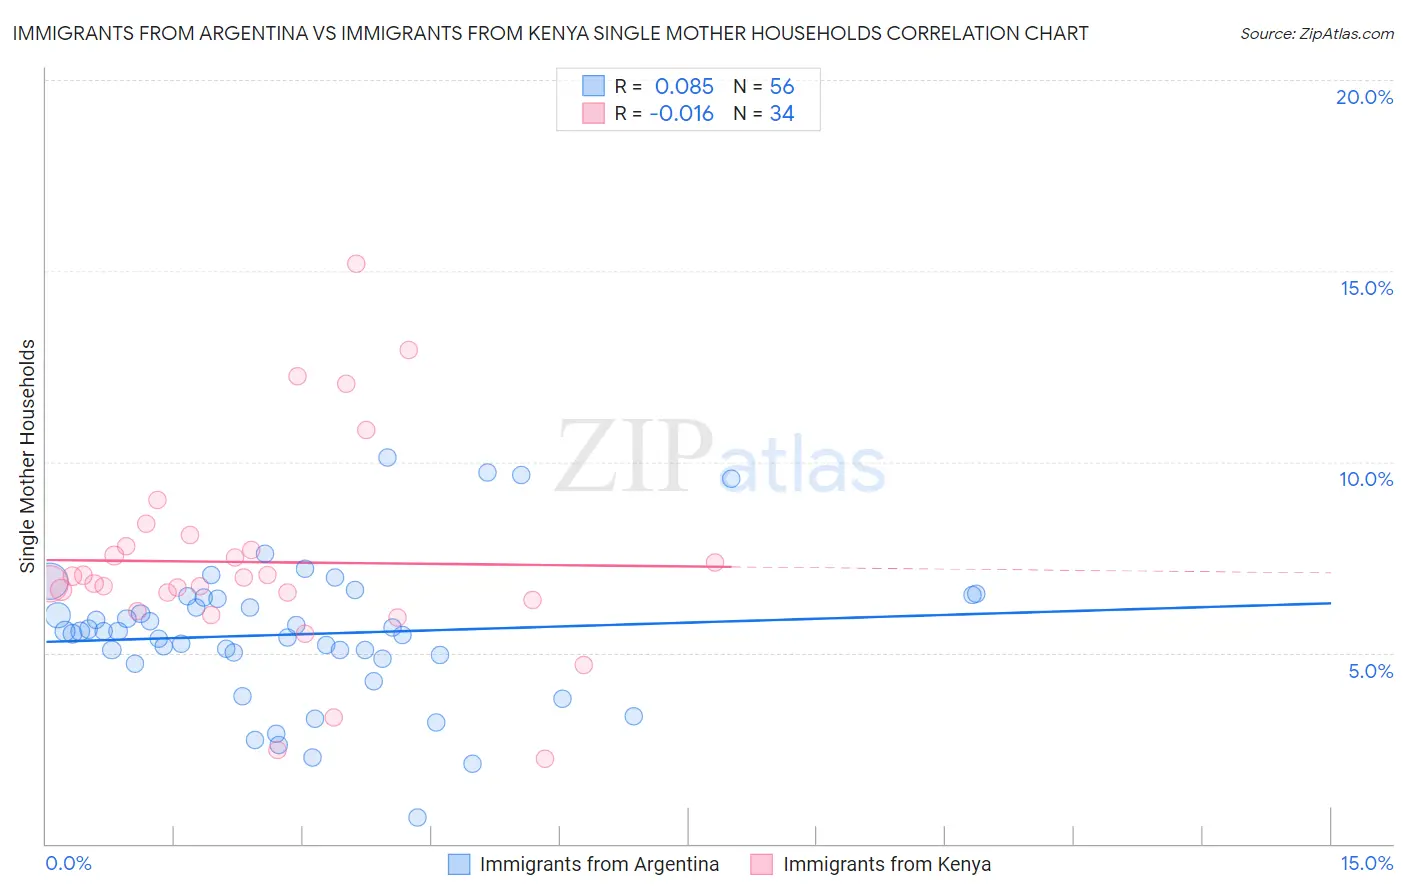
Immigrants from Argentina vs Immigrants from Kenya Single Mother Households Correlation Chart
The statistical analysis conducted on geographies consisting of 263,950,870 people shows a slight positive correlation between the proportion of Immigrants from Argentina and percentage of single mother households in the United States with a correlation coefficient (R) of 0.085 and weighted average of 5.9%. Similarly, the statistical analysis conducted on geographies consisting of 217,851,369 people shows no correlation between the proportion of Immigrants from Kenya and percentage of single mother households in the United States with a correlation coefficient (R) of -0.016 and weighted average of 7.0%, a difference of 19.1%.
Single Mother Households Correlation Summary
| Measurement | Immigrants from Argentina | Immigrants from Kenya |
| Minimum | 0.70% | 2.2% |
| Maximum | 10.1% | 15.2% |
| Range | 9.4% | 13.0% |
| Mean | 5.5% | 7.4% |
| Median | 5.6% | 6.9% |
| Interquartile 25% (IQ1) | 4.9% | 6.4% |
| Interquartile 75% (IQ3) | 6.4% | 7.8% |
| Interquartile Range (IQR) | 1.5% | 1.4% |
| Standard Deviation (Sample) | 1.8% | 2.7% |
| Standard Deviation (Population) | 1.8% | 2.7% |
Similar Demographics by Single Mother Households
Demographics Similar to Immigrants from Argentina by Single Mother Households
In terms of single mother households, the demographic groups most similar to Immigrants from Argentina are Immigrants from Uzbekistan (5.9%, a difference of 0.070%), Belgian (5.8%, a difference of 0.13%), Slavic (5.9%, a difference of 0.16%), Welsh (5.9%, a difference of 0.18%), and Argentinean (5.8%, a difference of 0.21%).
| Demographics | Rating | Rank | Single Mother Households |
| Bolivians | 94.6 /100 | #117 | Exceptional 5.8% |
| Laotians | 94.3 /100 | #118 | Exceptional 5.8% |
| South Africans | 94.1 /100 | #119 | Exceptional 5.8% |
| Tongans | 93.7 /100 | #120 | Exceptional 5.8% |
| Argentineans | 93.7 /100 | #121 | Exceptional 5.8% |
| Belgians | 93.5 /100 | #122 | Exceptional 5.8% |
| Immigrants | Uzbekistan | 93.4 /100 | #123 | Exceptional 5.9% |
| Immigrants | Argentina | 93.2 /100 | #124 | Exceptional 5.9% |
| Slavs | 92.9 /100 | #125 | Exceptional 5.9% |
| Welsh | 92.8 /100 | #126 | Exceptional 5.9% |
| Lebanese | 92.4 /100 | #127 | Exceptional 5.9% |
| Czechoslovakians | 92.2 /100 | #128 | Exceptional 5.9% |
| Immigrants | Bolivia | 92.2 /100 | #129 | Exceptional 5.9% |
| Palestinians | 92.1 /100 | #130 | Exceptional 5.9% |
| Immigrants | Spain | 91.2 /100 | #131 | Exceptional 5.9% |
Demographics Similar to Immigrants from Kenya by Single Mother Households
In terms of single mother households, the demographic groups most similar to Immigrants from Kenya are Iroquois (7.0%, a difference of 0.17%), Kenyan (7.0%, a difference of 0.20%), Paiute (7.0%, a difference of 0.34%), Creek (7.0%, a difference of 0.71%), and Spanish American (7.0%, a difference of 0.74%).
| Demographics | Rating | Rank | Single Mother Households |
| Immigrants | Bangladesh | 3.7 /100 | #222 | Tragic 6.9% |
| Immigrants | Micronesia | 3.6 /100 | #223 | Tragic 6.9% |
| Immigrants | Sudan | 3.5 /100 | #224 | Tragic 6.9% |
| Sudanese | 3.1 /100 | #225 | Tragic 6.9% |
| Paiute | 2.4 /100 | #226 | Tragic 7.0% |
| Kenyans | 2.3 /100 | #227 | Tragic 7.0% |
| Iroquois | 2.2 /100 | #228 | Tragic 7.0% |
| Immigrants | Kenya | 2.1 /100 | #229 | Tragic 7.0% |
| Creek | 1.6 /100 | #230 | Tragic 7.0% |
| Spanish Americans | 1.6 /100 | #231 | Tragic 7.0% |
| Comanche | 1.5 /100 | #232 | Tragic 7.0% |
| Choctaw | 1.4 /100 | #233 | Tragic 7.0% |
| Chickasaw | 1.4 /100 | #234 | Tragic 7.0% |
| Immigrants | Burma/Myanmar | 1.4 /100 | #235 | Tragic 7.0% |
| Ute | 1.0 /100 | #236 | Tragic 7.1% |