Immigrants from Argentina vs Immigrants from France Single Mother Households
COMPARE
Immigrants from Argentina
Immigrants from France
Single Mother Households
Single Mother Households Comparison
Immigrants from Argentina
Immigrants from France
5.9%
SINGLE MOTHER HOUSEHOLDS
93.2/ 100
METRIC RATING
124th/ 347
METRIC RANK
5.6%
SINGLE MOTHER HOUSEHOLDS
98.6/ 100
METRIC RATING
64th/ 347
METRIC RANK
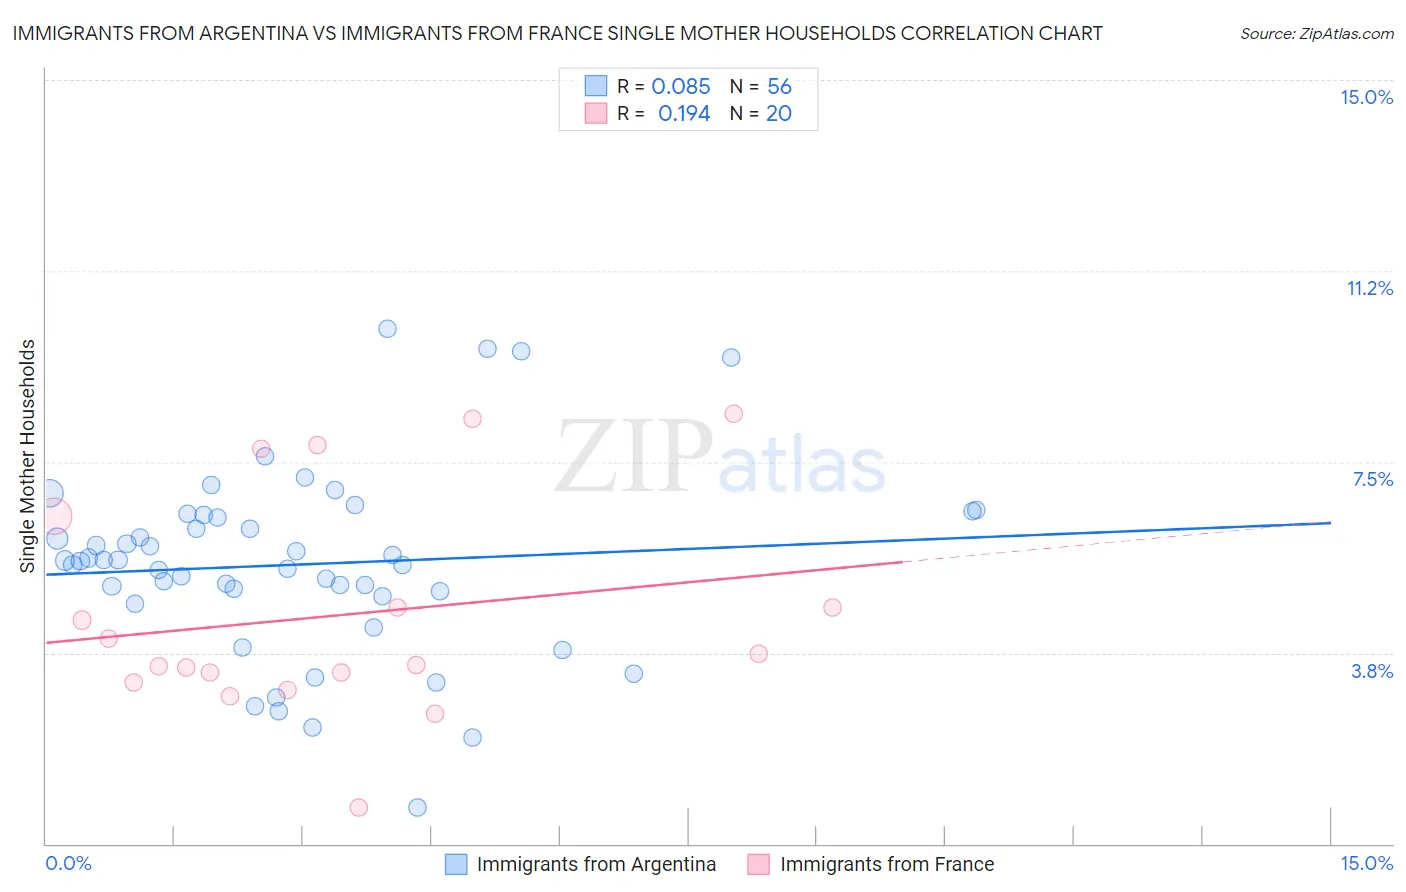
Immigrants from Argentina vs Immigrants from France Single Mother Households Correlation Chart
The statistical analysis conducted on geographies consisting of 263,950,870 people shows a slight positive correlation between the proportion of Immigrants from Argentina and percentage of single mother households in the United States with a correlation coefficient (R) of 0.085 and weighted average of 5.9%. Similarly, the statistical analysis conducted on geographies consisting of 287,388,565 people shows a poor positive correlation between the proportion of Immigrants from France and percentage of single mother households in the United States with a correlation coefficient (R) of 0.194 and weighted average of 5.6%, a difference of 5.0%.
Single Mother Households Correlation Summary
| Measurement | Immigrants from Argentina | Immigrants from France |
| Minimum | 0.70% | 0.71% |
| Maximum | 10.1% | 8.4% |
| Range | 9.4% | 7.7% |
| Mean | 5.5% | 4.5% |
| Median | 5.6% | 3.6% |
| Interquartile 25% (IQ1) | 4.9% | 3.3% |
| Interquartile 75% (IQ3) | 6.4% | 5.5% |
| Interquartile Range (IQR) | 1.5% | 2.3% |
| Standard Deviation (Sample) | 1.8% | 2.1% |
| Standard Deviation (Population) | 1.8% | 2.1% |
Similar Demographics by Single Mother Households
Demographics Similar to Immigrants from Argentina by Single Mother Households
In terms of single mother households, the demographic groups most similar to Immigrants from Argentina are Immigrants from Uzbekistan (5.9%, a difference of 0.070%), Belgian (5.8%, a difference of 0.13%), Slavic (5.9%, a difference of 0.16%), Welsh (5.9%, a difference of 0.18%), and Argentinean (5.8%, a difference of 0.21%).
| Demographics | Rating | Rank | Single Mother Households |
| Bolivians | 94.6 /100 | #117 | Exceptional 5.8% |
| Laotians | 94.3 /100 | #118 | Exceptional 5.8% |
| South Africans | 94.1 /100 | #119 | Exceptional 5.8% |
| Tongans | 93.7 /100 | #120 | Exceptional 5.8% |
| Argentineans | 93.7 /100 | #121 | Exceptional 5.8% |
| Belgians | 93.5 /100 | #122 | Exceptional 5.8% |
| Immigrants | Uzbekistan | 93.4 /100 | #123 | Exceptional 5.9% |
| Immigrants | Argentina | 93.2 /100 | #124 | Exceptional 5.9% |
| Slavs | 92.9 /100 | #125 | Exceptional 5.9% |
| Welsh | 92.8 /100 | #126 | Exceptional 5.9% |
| Lebanese | 92.4 /100 | #127 | Exceptional 5.9% |
| Czechoslovakians | 92.2 /100 | #128 | Exceptional 5.9% |
| Immigrants | Bolivia | 92.2 /100 | #129 | Exceptional 5.9% |
| Palestinians | 92.1 /100 | #130 | Exceptional 5.9% |
| Immigrants | Spain | 91.2 /100 | #131 | Exceptional 5.9% |
Demographics Similar to Immigrants from France by Single Mother Households
In terms of single mother households, the demographic groups most similar to Immigrants from France are Immigrants from North Macedonia (5.6%, a difference of 0.040%), Greek (5.6%, a difference of 0.040%), Polish (5.6%, a difference of 0.10%), Australian (5.6%, a difference of 0.12%), and Immigrants from Canada (5.6%, a difference of 0.15%).
| Demographics | Rating | Rank | Single Mother Households |
| Immigrants | Europe | 99.0 /100 | #57 | Exceptional 5.5% |
| Danes | 98.9 /100 | #58 | Exceptional 5.5% |
| Luxembourgers | 98.7 /100 | #59 | Exceptional 5.6% |
| Immigrants | Norway | 98.7 /100 | #60 | Exceptional 5.6% |
| Australians | 98.7 /100 | #61 | Exceptional 5.6% |
| Poles | 98.6 /100 | #62 | Exceptional 5.6% |
| Immigrants | North Macedonia | 98.6 /100 | #63 | Exceptional 5.6% |
| Immigrants | France | 98.6 /100 | #64 | Exceptional 5.6% |
| Greeks | 98.6 /100 | #65 | Exceptional 5.6% |
| Immigrants | Canada | 98.5 /100 | #66 | Exceptional 5.6% |
| Italians | 98.5 /100 | #67 | Exceptional 5.6% |
| Immigrants | Bulgaria | 98.5 /100 | #68 | Exceptional 5.6% |
| Asians | 98.5 /100 | #69 | Exceptional 5.6% |
| Immigrants | Eastern Europe | 98.4 /100 | #70 | Exceptional 5.6% |
| Immigrants | Kazakhstan | 98.4 /100 | #71 | Exceptional 5.6% |