Immigrants from Argentina vs Immigrants from Western Asia 8th Grade
COMPARE
Immigrants from Argentina
Immigrants from Western Asia
8th Grade
8th Grade Comparison
Immigrants from Argentina
Immigrants from Western Asia
95.5%
8TH GRADE
20.6/ 100
METRIC RATING
201st/ 347
METRIC RANK
95.3%
8TH GRADE
6.0/ 100
METRIC RATING
224th/ 347
METRIC RANK
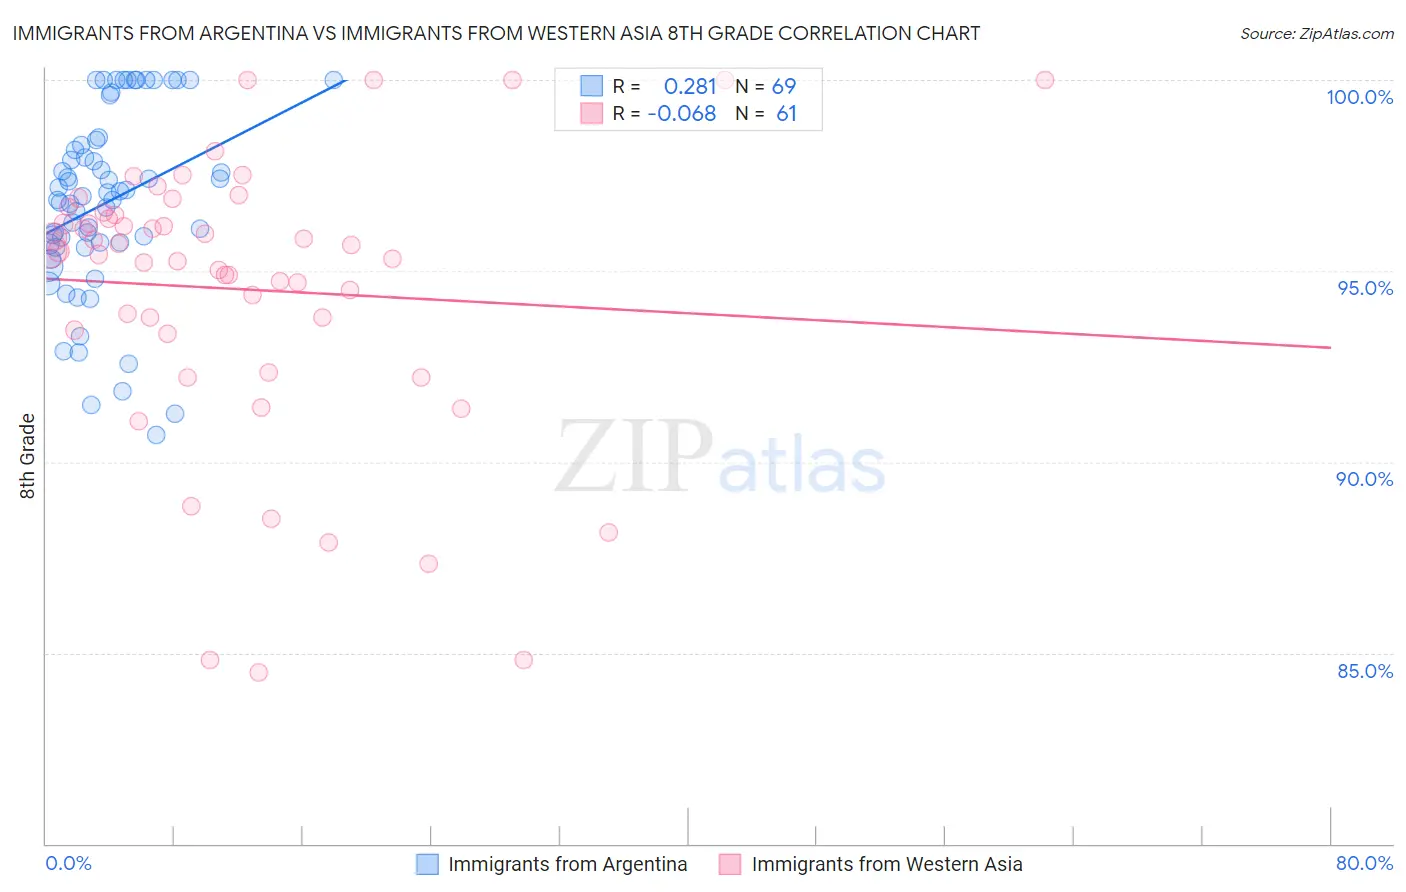
Immigrants from Argentina vs Immigrants from Western Asia 8th Grade Correlation Chart
The statistical analysis conducted on geographies consisting of 264,437,906 people shows a weak positive correlation between the proportion of Immigrants from Argentina and percentage of population with at least 8th grade education in the United States with a correlation coefficient (R) of 0.281 and weighted average of 95.5%. Similarly, the statistical analysis conducted on geographies consisting of 404,433,811 people shows a slight negative correlation between the proportion of Immigrants from Western Asia and percentage of population with at least 8th grade education in the United States with a correlation coefficient (R) of -0.068 and weighted average of 95.3%, a difference of 0.23%.
8th Grade Correlation Summary
| Measurement | Immigrants from Argentina | Immigrants from Western Asia |
| Minimum | 90.7% | 84.5% |
| Maximum | 100.0% | 100.0% |
| Range | 9.3% | 15.5% |
| Mean | 96.8% | 94.5% |
| Median | 97.0% | 95.5% |
| Interquartile 25% (IQ1) | 95.7% | 93.4% |
| Interquartile 75% (IQ3) | 98.4% | 96.5% |
| Interquartile Range (IQR) | 2.7% | 3.1% |
| Standard Deviation (Sample) | 2.4% | 3.7% |
| Standard Deviation (Population) | 2.4% | 3.6% |
Similar Demographics by 8th Grade
Demographics Similar to Immigrants from Argentina by 8th Grade
In terms of 8th grade, the demographic groups most similar to Immigrants from Argentina are Apache (95.5%, a difference of 0.010%), Paraguayan (95.5%, a difference of 0.020%), Immigrants from Northern Africa (95.5%, a difference of 0.020%), Argentinean (95.5%, a difference of 0.020%), and Sierra Leonean (95.6%, a difference of 0.030%).
| Demographics | Rating | Rank | 8th Grade |
| Guamanians/Chamorros | 26.6 /100 | #194 | Fair 95.6% |
| Immigrants | Zaire | 25.2 /100 | #195 | Fair 95.6% |
| Assyrians/Chaldeans/Syriacs | 24.5 /100 | #196 | Fair 95.6% |
| Sierra Leoneans | 24.3 /100 | #197 | Fair 95.6% |
| Paraguayans | 22.6 /100 | #198 | Fair 95.5% |
| Immigrants | Northern Africa | 22.5 /100 | #199 | Fair 95.5% |
| Argentineans | 22.2 /100 | #200 | Fair 95.5% |
| Immigrants | Argentina | 20.6 /100 | #201 | Fair 95.5% |
| Apache | 19.4 /100 | #202 | Poor 95.5% |
| Moroccans | 17.4 /100 | #203 | Poor 95.5% |
| Hawaiians | 16.7 /100 | #204 | Poor 95.5% |
| Immigrants | Bahamas | 16.7 /100 | #205 | Poor 95.5% |
| Comanche | 16.3 /100 | #206 | Poor 95.5% |
| Immigrants | Sudan | 15.1 /100 | #207 | Poor 95.5% |
| Portuguese | 14.3 /100 | #208 | Poor 95.5% |
Demographics Similar to Immigrants from Western Asia by 8th Grade
In terms of 8th grade, the demographic groups most similar to Immigrants from Western Asia are Subsaharan African (95.3%, a difference of 0.0%), Navajo (95.3%, a difference of 0.010%), Bahamian (95.3%, a difference of 0.010%), Immigrants from Eastern Africa (95.3%, a difference of 0.010%), and Immigrants from Malaysia (95.3%, a difference of 0.030%).
| Demographics | Rating | Rank | 8th Grade |
| Immigrants | Eastern Asia | 8.3 /100 | #217 | Tragic 95.4% |
| Dutch West Indians | 8.1 /100 | #218 | Tragic 95.4% |
| Spanish Americans | 8.0 /100 | #219 | Tragic 95.4% |
| Immigrants | Southern Europe | 7.7 /100 | #220 | Tragic 95.3% |
| Immigrants | Syria | 7.4 /100 | #221 | Tragic 95.3% |
| Immigrants | Malaysia | 7.3 /100 | #222 | Tragic 95.3% |
| Immigrants | Oceania | 7.1 /100 | #223 | Tragic 95.3% |
| Immigrants | Western Asia | 6.0 /100 | #224 | Tragic 95.3% |
| Sub-Saharan Africans | 6.0 /100 | #225 | Tragic 95.3% |
| Navajo | 5.7 /100 | #226 | Tragic 95.3% |
| Bahamians | 5.6 /100 | #227 | Tragic 95.3% |
| Immigrants | Eastern Africa | 5.6 /100 | #228 | Tragic 95.3% |
| Immigrants | Indonesia | 4.4 /100 | #229 | Tragic 95.3% |
| Immigrants | Panama | 4.1 /100 | #230 | Tragic 95.2% |
| Asians | 3.5 /100 | #231 | Tragic 95.2% |