Immigrants from Argentina vs Spanish Average Family Size
COMPARE
Immigrants from Argentina
Spanish
Average Family Size
Average Family Size Comparison
Immigrants from Argentina
Spanish
3.22
AVERAGE FAMILY SIZE
39.8/ 100
METRIC RATING
186th/ 347
METRIC RANK
3.23
AVERAGE FAMILY SIZE
44.8/ 100
METRIC RATING
181st/ 347
METRIC RANK
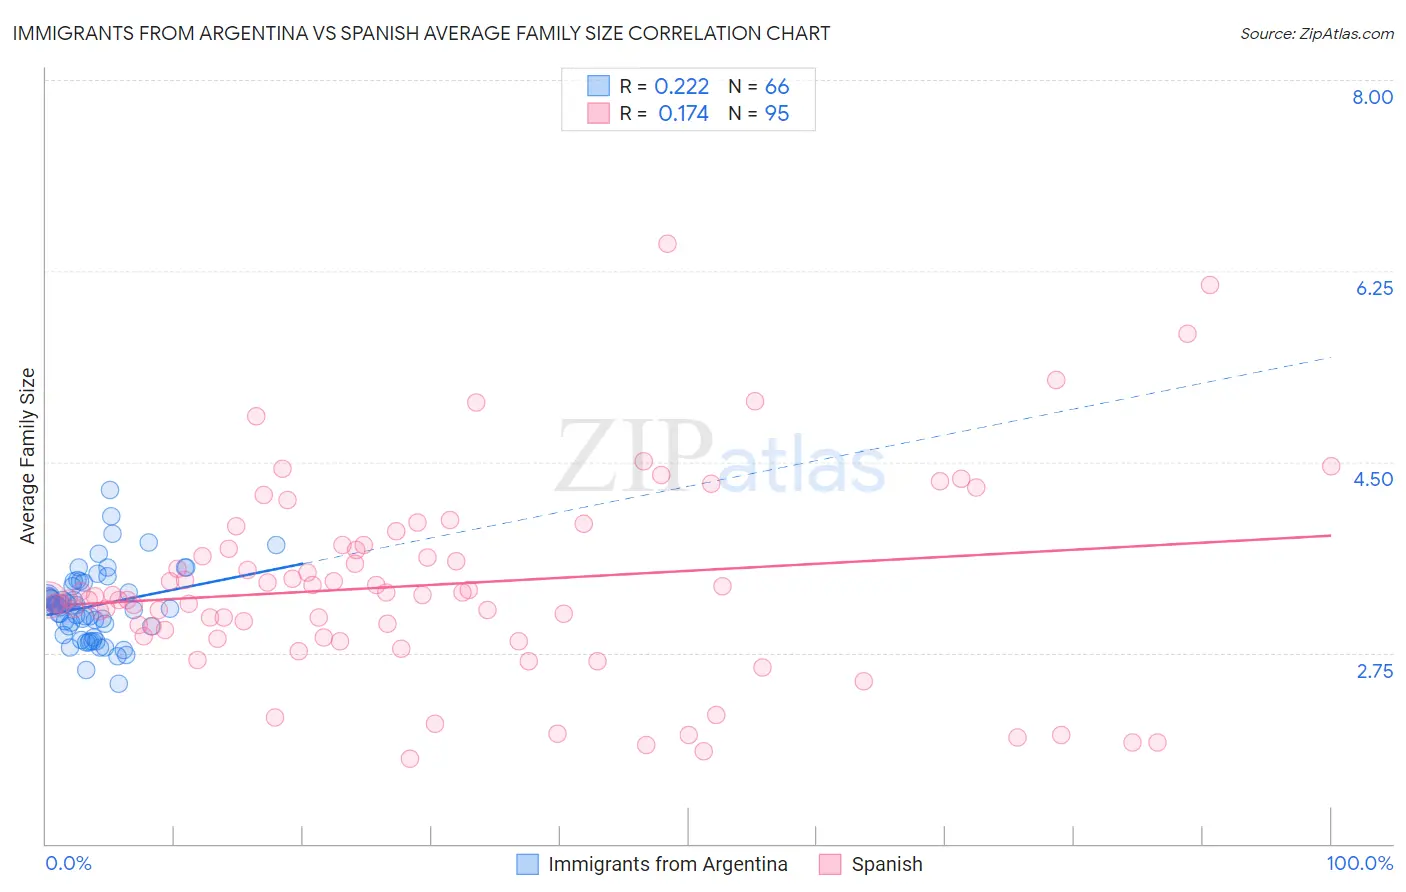
Immigrants from Argentina vs Spanish Average Family Size Correlation Chart
The statistical analysis conducted on geographies consisting of 264,360,356 people shows a weak positive correlation between the proportion of Immigrants from Argentina and average family size in the United States with a correlation coefficient (R) of 0.222 and weighted average of 3.22. Similarly, the statistical analysis conducted on geographies consisting of 421,920,076 people shows a poor positive correlation between the proportion of Spanish and average family size in the United States with a correlation coefficient (R) of 0.174 and weighted average of 3.23, a difference of 0.090%.
Average Family Size Correlation Summary
| Measurement | Immigrants from Argentina | Spanish |
| Minimum | 2.47 | 1.78 |
| Maximum | 4.24 | 6.50 |
| Range | 1.77 | 4.72 |
| Mean | 3.18 | 3.37 |
| Median | 3.18 | 3.26 |
| Interquartile 25% (IQ1) | 2.99 | 2.90 |
| Interquartile 75% (IQ3) | 3.36 | 3.73 |
| Interquartile Range (IQR) | 0.37 | 0.83 |
| Standard Deviation (Sample) | 0.33 | 0.90 |
| Standard Deviation (Population) | 0.32 | 0.89 |
Demographics Similar to Immigrants from Argentina and Spanish by Average Family Size
In terms of average family size, the demographic groups most similar to Immigrants from Argentina are Immigrants from Sri Lanka (3.22, a difference of 0.0%), Immigrants from Eastern Asia (3.22, a difference of 0.020%), Immigrants from Malaysia (3.22, a difference of 0.020%), Thai (3.22, a difference of 0.030%), and Immigrants from Northern Africa (3.22, a difference of 0.040%). Similarly, the demographic groups most similar to Spanish are Moroccan (3.22, a difference of 0.010%), Palestinian (3.23, a difference of 0.030%), Spaniard (3.23, a difference of 0.040%), Immigrants from Korea (3.23, a difference of 0.040%), and Argentinean (3.23, a difference of 0.050%).
| Demographics | Rating | Rank | Average Family Size |
| Immigrants | Uruguay | 52.0 /100 | #173 | Average 3.23 |
| Immigrants | South Central Asia | 50.0 /100 | #174 | Average 3.23 |
| Immigrants | China | 49.9 /100 | #175 | Average 3.23 |
| Israelis | 48.7 /100 | #176 | Average 3.23 |
| Argentineans | 47.4 /100 | #177 | Average 3.23 |
| Spaniards | 47.2 /100 | #178 | Average 3.23 |
| Immigrants | Korea | 46.9 /100 | #179 | Average 3.23 |
| Palestinians | 46.6 /100 | #180 | Average 3.23 |
| Spanish | 44.8 /100 | #181 | Average 3.23 |
| Moroccans | 44.2 /100 | #182 | Average 3.22 |
| Immigrants | Northern Africa | 41.7 /100 | #183 | Average 3.22 |
| Immigrants | Eastern Asia | 40.8 /100 | #184 | Average 3.22 |
| Immigrants | Sri Lanka | 39.8 /100 | #185 | Fair 3.22 |
| Immigrants | Argentina | 39.8 /100 | #186 | Fair 3.22 |
| Immigrants | Malaysia | 39.0 /100 | #187 | Fair 3.22 |
| Thais | 38.3 /100 | #188 | Fair 3.22 |
| Pakistanis | 33.7 /100 | #189 | Fair 3.22 |
| Burmese | 31.0 /100 | #190 | Fair 3.22 |
| Immigrants | Zaire | 30.5 /100 | #191 | Fair 3.22 |
| Immigrants | Eastern Africa | 30.1 /100 | #192 | Fair 3.22 |
| Immigrants | Israel | 29.3 /100 | #193 | Fair 3.22 |