Immigrants from Albania vs Portuguese Currently Married
COMPARE
Immigrants from Albania
Portuguese
Currently Married
Currently Married Comparison
Immigrants from Albania
Portuguese
45.9%
CURRENTLY MARRIED
14.5/ 100
METRIC RATING
202nd/ 347
METRIC RANK
47.3%
CURRENTLY MARRIED
84.2/ 100
METRIC RATING
128th/ 347
METRIC RANK
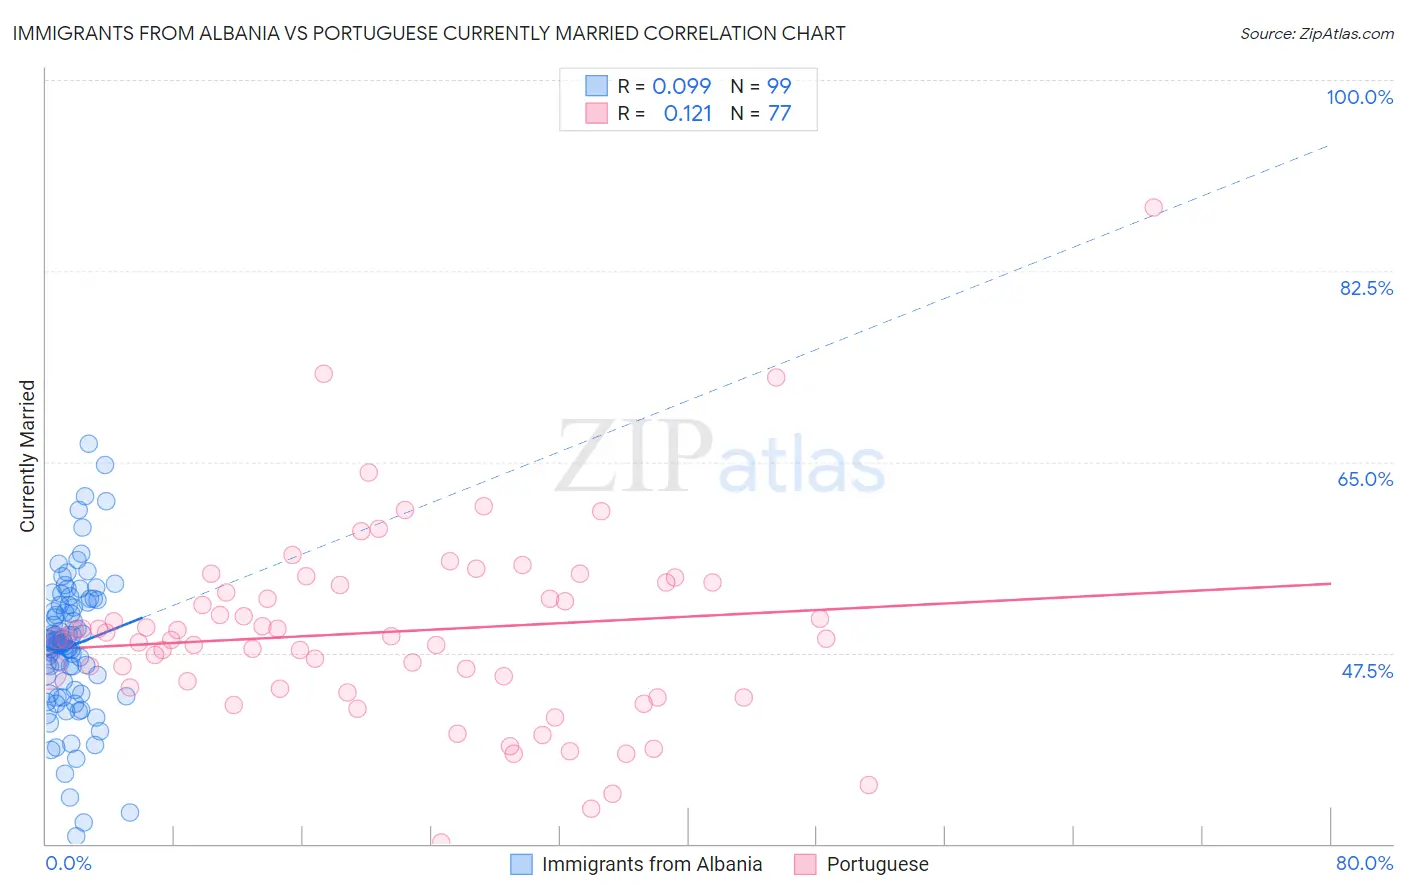
Immigrants from Albania vs Portuguese Currently Married Correlation Chart
The statistical analysis conducted on geographies consisting of 119,394,885 people shows a slight positive correlation between the proportion of Immigrants from Albania and percentage of population currently married in the United States with a correlation coefficient (R) of 0.099 and weighted average of 45.9%. Similarly, the statistical analysis conducted on geographies consisting of 450,286,612 people shows a poor positive correlation between the proportion of Portuguese and percentage of population currently married in the United States with a correlation coefficient (R) of 0.121 and weighted average of 47.3%, a difference of 3.2%.
Currently Married Correlation Summary
| Measurement | Immigrants from Albania | Portuguese |
| Minimum | 30.7% | 30.1% |
| Maximum | 66.7% | 88.3% |
| Range | 36.0% | 58.2% |
| Mean | 48.1% | 49.4% |
| Median | 48.4% | 48.9% |
| Interquartile 25% (IQ1) | 43.7% | 44.3% |
| Interquartile 75% (IQ3) | 51.9% | 53.9% |
| Interquartile Range (IQR) | 8.2% | 9.5% |
| Standard Deviation (Sample) | 6.5% | 8.9% |
| Standard Deviation (Population) | 6.4% | 8.9% |
Similar Demographics by Currently Married
Demographics Similar to Immigrants from Albania by Currently Married
In terms of currently married, the demographic groups most similar to Immigrants from Albania are Malaysian (45.9%, a difference of 0.060%), Creek (46.0%, a difference of 0.19%), Taiwanese (45.8%, a difference of 0.23%), Immigrants from Spain (45.8%, a difference of 0.24%), and South American Indian (45.8%, a difference of 0.25%).
| Demographics | Rating | Rank | Currently Married |
| Immigrants | Nepal | 23.7 /100 | #195 | Fair 46.1% |
| Immigrants | Bosnia and Herzegovina | 22.2 /100 | #196 | Fair 46.1% |
| Immigrants | Kuwait | 21.7 /100 | #197 | Fair 46.1% |
| Immigrants | Colombia | 21.0 /100 | #198 | Fair 46.1% |
| Immigrants | Costa Rica | 19.6 /100 | #199 | Poor 46.0% |
| Creek | 17.2 /100 | #200 | Poor 46.0% |
| Malaysians | 15.3 /100 | #201 | Poor 45.9% |
| Immigrants | Albania | 14.5 /100 | #202 | Poor 45.9% |
| Taiwanese | 11.7 /100 | #203 | Poor 45.8% |
| Immigrants | Spain | 11.6 /100 | #204 | Poor 45.8% |
| South American Indians | 11.5 /100 | #205 | Poor 45.8% |
| Immigrants | Immigrants | 11.2 /100 | #206 | Poor 45.8% |
| Immigrants | South America | 10.8 /100 | #207 | Poor 45.7% |
| Alsatians | 10.8 /100 | #208 | Poor 45.7% |
| Immigrants | Micronesia | 8.8 /100 | #209 | Tragic 45.6% |
Demographics Similar to Portuguese by Currently Married
In terms of currently married, the demographic groups most similar to Portuguese are New Zealander (47.4%, a difference of 0.040%), Immigrants from Jordan (47.4%, a difference of 0.050%), Sri Lankan (47.3%, a difference of 0.060%), Okinawan (47.4%, a difference of 0.080%), and Immigrants from Iraq (47.3%, a difference of 0.090%).
| Demographics | Rating | Rank | Currently Married |
| Immigrants | Croatia | 88.6 /100 | #121 | Excellent 47.5% |
| Osage | 87.9 /100 | #122 | Excellent 47.5% |
| Immigrants | Kazakhstan | 87.2 /100 | #123 | Excellent 47.4% |
| Laotians | 86.6 /100 | #124 | Excellent 47.4% |
| Okinawans | 85.3 /100 | #125 | Excellent 47.4% |
| Immigrants | Jordan | 84.9 /100 | #126 | Excellent 47.4% |
| New Zealanders | 84.9 /100 | #127 | Excellent 47.4% |
| Portuguese | 84.2 /100 | #128 | Excellent 47.3% |
| Sri Lankans | 83.2 /100 | #129 | Excellent 47.3% |
| Immigrants | Iraq | 82.8 /100 | #130 | Excellent 47.3% |
| Icelanders | 82.4 /100 | #131 | Excellent 47.3% |
| Afghans | 81.8 /100 | #132 | Excellent 47.3% |
| Immigrants | Malaysia | 81.1 /100 | #133 | Excellent 47.3% |
| Immigrants | Australia | 81.1 /100 | #134 | Excellent 47.3% |
| Immigrants | Norway | 79.7 /100 | #135 | Good 47.2% |