Immigrants from Afghanistan vs Cambodian Single Father Households
COMPARE
Immigrants from Afghanistan
Cambodian
Single Father Households
Single Father Households Comparison
Immigrants from Afghanistan
Cambodians
2.4%
SINGLE FATHER HOUSEHOLDS
24.2/ 100
METRIC RATING
205th/ 347
METRIC RANK
2.0%
SINGLE FATHER HOUSEHOLDS
100.0/ 100
METRIC RATING
30th/ 347
METRIC RANK
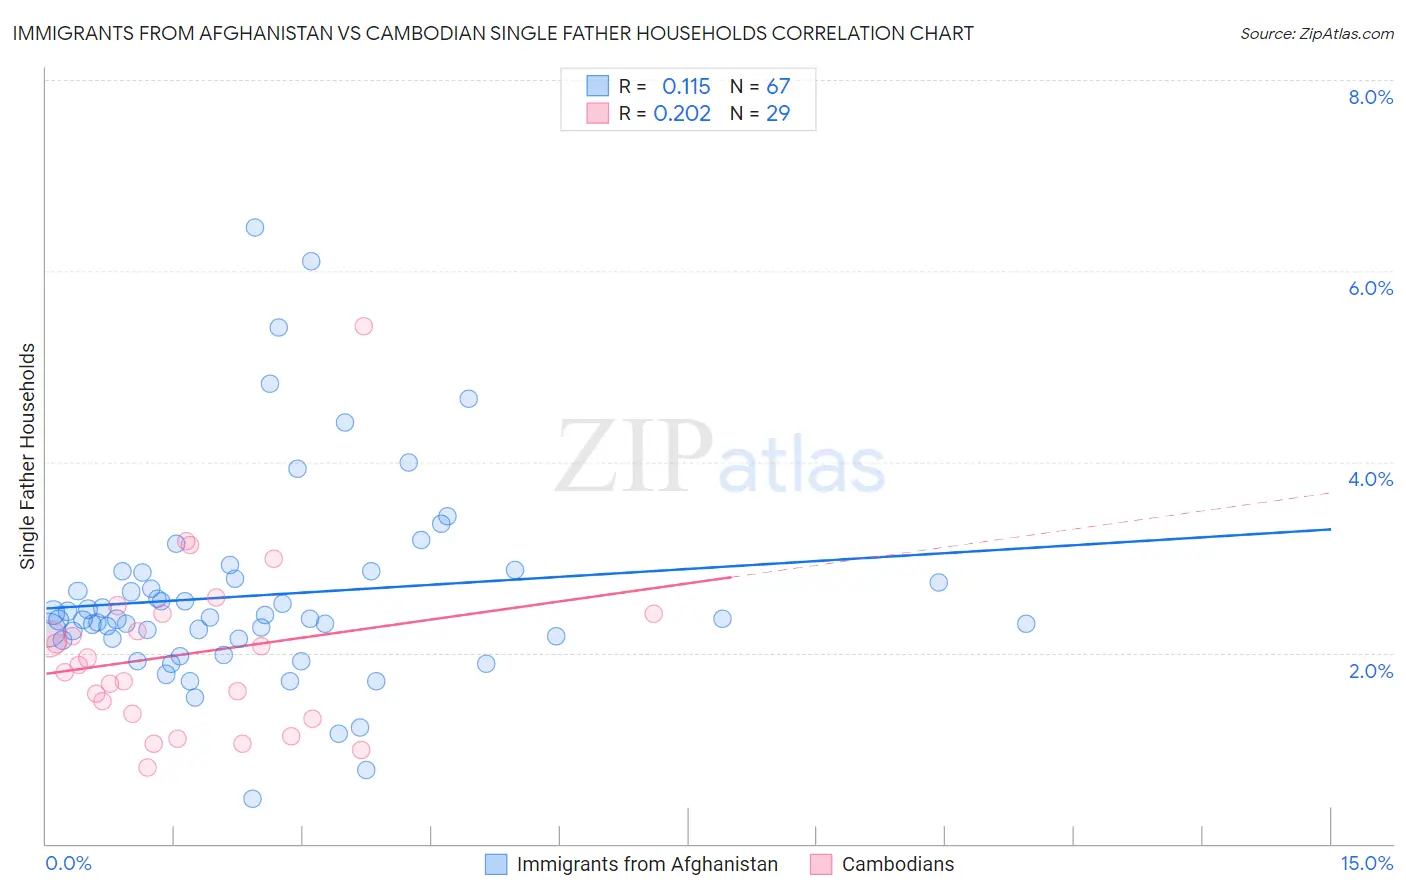
Immigrants from Afghanistan vs Cambodian Single Father Households Correlation Chart
The statistical analysis conducted on geographies consisting of 147,265,555 people shows a poor positive correlation between the proportion of Immigrants from Afghanistan and percentage of single father households in the United States with a correlation coefficient (R) of 0.115 and weighted average of 2.4%. Similarly, the statistical analysis conducted on geographies consisting of 102,339,342 people shows a weak positive correlation between the proportion of Cambodians and percentage of single father households in the United States with a correlation coefficient (R) of 0.202 and weighted average of 2.0%, a difference of 21.1%.
Single Father Households Correlation Summary
| Measurement | Immigrants from Afghanistan | Cambodian |
| Minimum | 0.48% | 0.80% |
| Maximum | 6.5% | 5.4% |
| Range | 6.0% | 4.6% |
| Mean | 2.6% | 2.0% |
| Median | 2.4% | 1.9% |
| Interquartile 25% (IQ1) | 2.1% | 1.3% |
| Interquartile 75% (IQ3) | 2.8% | 2.4% |
| Interquartile Range (IQR) | 0.70% | 1.1% |
| Standard Deviation (Sample) | 1.1% | 0.92% |
| Standard Deviation (Population) | 1.1% | 0.91% |
Similar Demographics by Single Father Households
Demographics Similar to Immigrants from Afghanistan by Single Father Households
In terms of single father households, the demographic groups most similar to Immigrants from Afghanistan are Korean (2.4%, a difference of 0.0%), Ecuadorian (2.4%, a difference of 0.030%), French Canadian (2.4%, a difference of 0.050%), German Russian (2.4%, a difference of 0.15%), and White/Caucasian (2.4%, a difference of 0.16%).
| Demographics | Rating | Rank | Single Father Households |
| Scandinavians | 27.4 /100 | #198 | Fair 2.4% |
| Immigrants | Vietnam | 27.1 /100 | #199 | Fair 2.4% |
| Peruvians | 27.1 /100 | #200 | Fair 2.4% |
| Immigrants | Uganda | 26.0 /100 | #201 | Fair 2.4% |
| German Russians | 25.7 /100 | #202 | Fair 2.4% |
| French Canadians | 24.7 /100 | #203 | Fair 2.4% |
| Ecuadorians | 24.5 /100 | #204 | Fair 2.4% |
| Immigrants | Afghanistan | 24.2 /100 | #205 | Fair 2.4% |
| Koreans | 24.1 /100 | #206 | Fair 2.4% |
| Whites/Caucasians | 22.6 /100 | #207 | Fair 2.4% |
| Immigrants | Kenya | 20.3 /100 | #208 | Fair 2.4% |
| Immigrants | Peru | 19.3 /100 | #209 | Poor 2.4% |
| Immigrants | Costa Rica | 19.2 /100 | #210 | Poor 2.4% |
| Immigrants | Nigeria | 18.7 /100 | #211 | Poor 2.4% |
| Finns | 18.3 /100 | #212 | Poor 2.4% |
Demographics Similar to Cambodians by Single Father Households
In terms of single father households, the demographic groups most similar to Cambodians are Bulgarian (2.0%, a difference of 0.020%), Israeli (2.0%, a difference of 0.030%), Chinese (2.0%, a difference of 0.070%), Immigrants from Japan (2.0%, a difference of 0.11%), and Turkish (2.0%, a difference of 0.28%).
| Demographics | Rating | Rank | Single Father Households |
| Immigrants | Croatia | 100.0 /100 | #23 | Exceptional 2.0% |
| Immigrants | Russia | 100.0 /100 | #24 | Exceptional 2.0% |
| Eastern Europeans | 100.0 /100 | #25 | Exceptional 2.0% |
| Assyrians/Chaldeans/Syriacs | 100.0 /100 | #26 | Exceptional 2.0% |
| Immigrants | South Central Asia | 100.0 /100 | #27 | Exceptional 2.0% |
| Immigrants | Japan | 100.0 /100 | #28 | Exceptional 2.0% |
| Bulgarians | 100.0 /100 | #29 | Exceptional 2.0% |
| Cambodians | 100.0 /100 | #30 | Exceptional 2.0% |
| Israelis | 100.0 /100 | #31 | Exceptional 2.0% |
| Chinese | 100.0 /100 | #32 | Exceptional 2.0% |
| Turks | 100.0 /100 | #33 | Exceptional 2.0% |
| Immigrants | Australia | 100.0 /100 | #34 | Exceptional 2.0% |
| Albanians | 100.0 /100 | #35 | Exceptional 2.0% |
| Immigrants | Belgium | 100.0 /100 | #36 | Exceptional 2.0% |
| Immigrants | St. Vincent and the Grenadines | 100.0 /100 | #37 | Exceptional 2.0% |