Immigrants from Western Africa vs Cambodian Single Father Households
COMPARE
Immigrants from Western Africa
Cambodian
Single Father Households
Single Father Households Comparison
Immigrants from Western Africa
Cambodians
2.4%
SINGLE FATHER HOUSEHOLDS
7.0/ 100
METRIC RATING
233rd/ 347
METRIC RANK
2.0%
SINGLE FATHER HOUSEHOLDS
100.0/ 100
METRIC RATING
30th/ 347
METRIC RANK
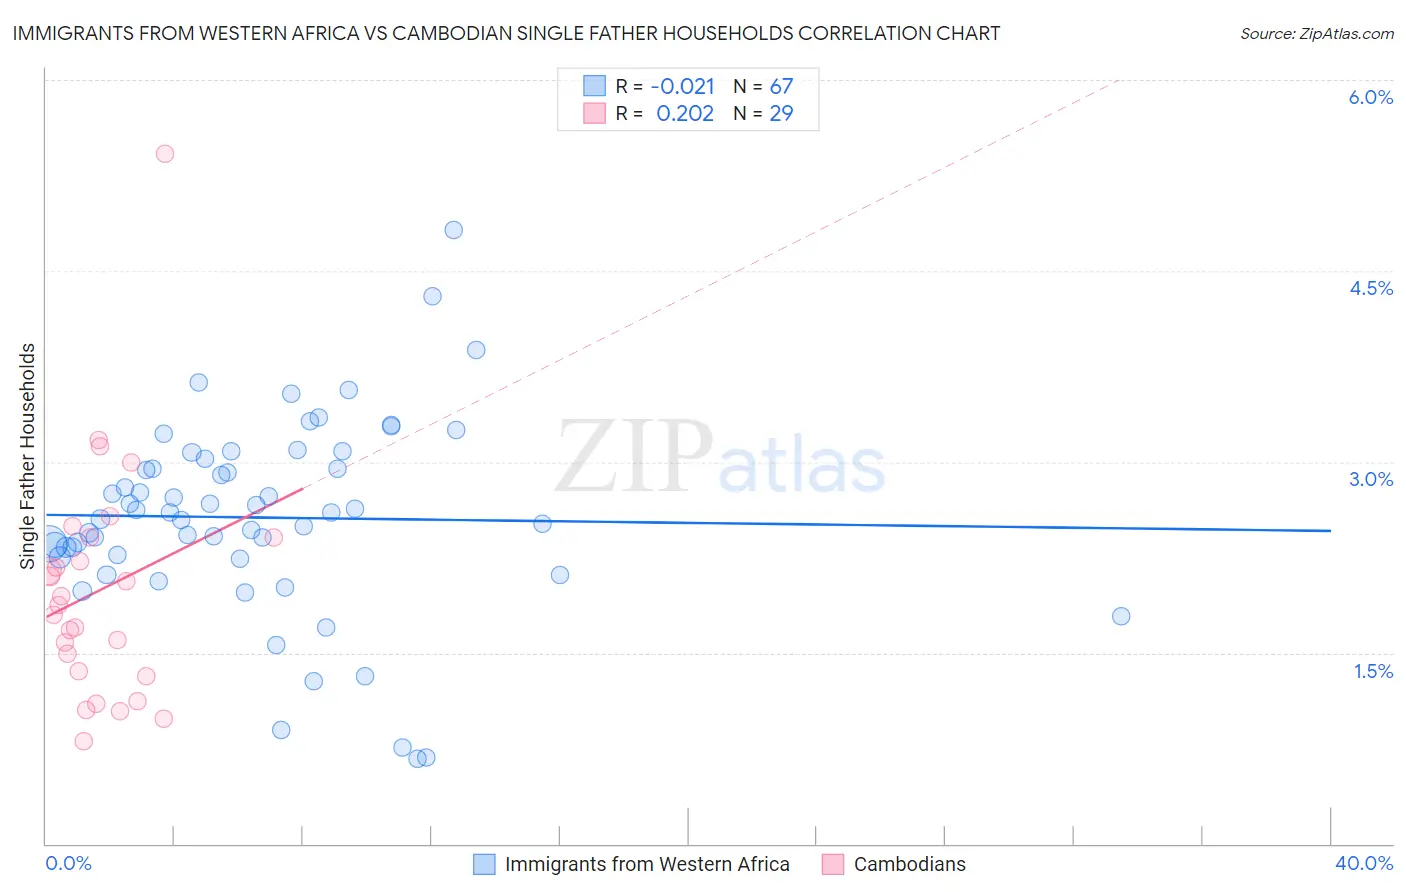
Immigrants from Western Africa vs Cambodian Single Father Households Correlation Chart
The statistical analysis conducted on geographies consisting of 355,561,724 people shows no correlation between the proportion of Immigrants from Western Africa and percentage of single father households in the United States with a correlation coefficient (R) of -0.021 and weighted average of 2.4%. Similarly, the statistical analysis conducted on geographies consisting of 102,339,342 people shows a weak positive correlation between the proportion of Cambodians and percentage of single father households in the United States with a correlation coefficient (R) of 0.202 and weighted average of 2.0%, a difference of 24.2%.
Single Father Households Correlation Summary
| Measurement | Immigrants from Western Africa | Cambodian |
| Minimum | 0.66% | 0.80% |
| Maximum | 4.8% | 5.4% |
| Range | 4.2% | 4.6% |
| Mean | 2.6% | 2.0% |
| Median | 2.6% | 1.9% |
| Interquartile 25% (IQ1) | 2.3% | 1.3% |
| Interquartile 75% (IQ3) | 3.0% | 2.4% |
| Interquartile Range (IQR) | 0.77% | 1.1% |
| Standard Deviation (Sample) | 0.77% | 0.92% |
| Standard Deviation (Population) | 0.77% | 0.91% |
Similar Demographics by Single Father Households
Demographics Similar to Immigrants from Western Africa by Single Father Households
In terms of single father households, the demographic groups most similar to Immigrants from Western Africa are Pennsylvania German (2.4%, a difference of 0.060%), Nonimmigrants (2.4%, a difference of 0.14%), African (2.5%, a difference of 0.20%), Immigrants (2.5%, a difference of 0.22%), and Cajun (2.5%, a difference of 0.27%).
| Demographics | Rating | Rank | Single Father Households |
| Blacks/African Americans | 9.7 /100 | #226 | Tragic 2.4% |
| Americans | 9.3 /100 | #227 | Tragic 2.4% |
| Immigrants | Ghana | 9.1 /100 | #228 | Tragic 2.4% |
| Immigrants | Zaire | 8.6 /100 | #229 | Tragic 2.4% |
| Sub-Saharan Africans | 8.3 /100 | #230 | Tragic 2.4% |
| Immigrants | Nonimmigrants | 7.6 /100 | #231 | Tragic 2.4% |
| Pennsylvania Germans | 7.3 /100 | #232 | Tragic 2.4% |
| Immigrants | Western Africa | 7.0 /100 | #233 | Tragic 2.4% |
| Africans | 6.3 /100 | #234 | Tragic 2.5% |
| Immigrants | Immigrants | 6.3 /100 | #235 | Tragic 2.5% |
| Cajuns | 6.1 /100 | #236 | Tragic 2.5% |
| Sierra Leoneans | 5.9 /100 | #237 | Tragic 2.5% |
| Immigrants | Sierra Leone | 5.8 /100 | #238 | Tragic 2.5% |
| Immigrants | Oceania | 5.8 /100 | #239 | Tragic 2.5% |
| Immigrants | Dominica | 4.8 /100 | #240 | Tragic 2.5% |
Demographics Similar to Cambodians by Single Father Households
In terms of single father households, the demographic groups most similar to Cambodians are Bulgarian (2.0%, a difference of 0.020%), Israeli (2.0%, a difference of 0.030%), Chinese (2.0%, a difference of 0.070%), Immigrants from Japan (2.0%, a difference of 0.11%), and Turkish (2.0%, a difference of 0.28%).
| Demographics | Rating | Rank | Single Father Households |
| Immigrants | Croatia | 100.0 /100 | #23 | Exceptional 2.0% |
| Immigrants | Russia | 100.0 /100 | #24 | Exceptional 2.0% |
| Eastern Europeans | 100.0 /100 | #25 | Exceptional 2.0% |
| Assyrians/Chaldeans/Syriacs | 100.0 /100 | #26 | Exceptional 2.0% |
| Immigrants | South Central Asia | 100.0 /100 | #27 | Exceptional 2.0% |
| Immigrants | Japan | 100.0 /100 | #28 | Exceptional 2.0% |
| Bulgarians | 100.0 /100 | #29 | Exceptional 2.0% |
| Cambodians | 100.0 /100 | #30 | Exceptional 2.0% |
| Israelis | 100.0 /100 | #31 | Exceptional 2.0% |
| Chinese | 100.0 /100 | #32 | Exceptional 2.0% |
| Turks | 100.0 /100 | #33 | Exceptional 2.0% |
| Immigrants | Australia | 100.0 /100 | #34 | Exceptional 2.0% |
| Albanians | 100.0 /100 | #35 | Exceptional 2.0% |
| Immigrants | Belgium | 100.0 /100 | #36 | Exceptional 2.0% |
| Immigrants | St. Vincent and the Grenadines | 100.0 /100 | #37 | Exceptional 2.0% |