Icelander vs Immigrants from Uganda Single Mother Households
COMPARE
Icelander
Immigrants from Uganda
Single Mother Households
Single Mother Households Comparison
Icelanders
Immigrants from Uganda
6.0%
SINGLE MOTHER HOUSEHOLDS
86.9/ 100
METRIC RATING
138th/ 347
METRIC RANK
6.6%
SINGLE MOTHER HOUSEHOLDS
18.3/ 100
METRIC RATING
194th/ 347
METRIC RANK
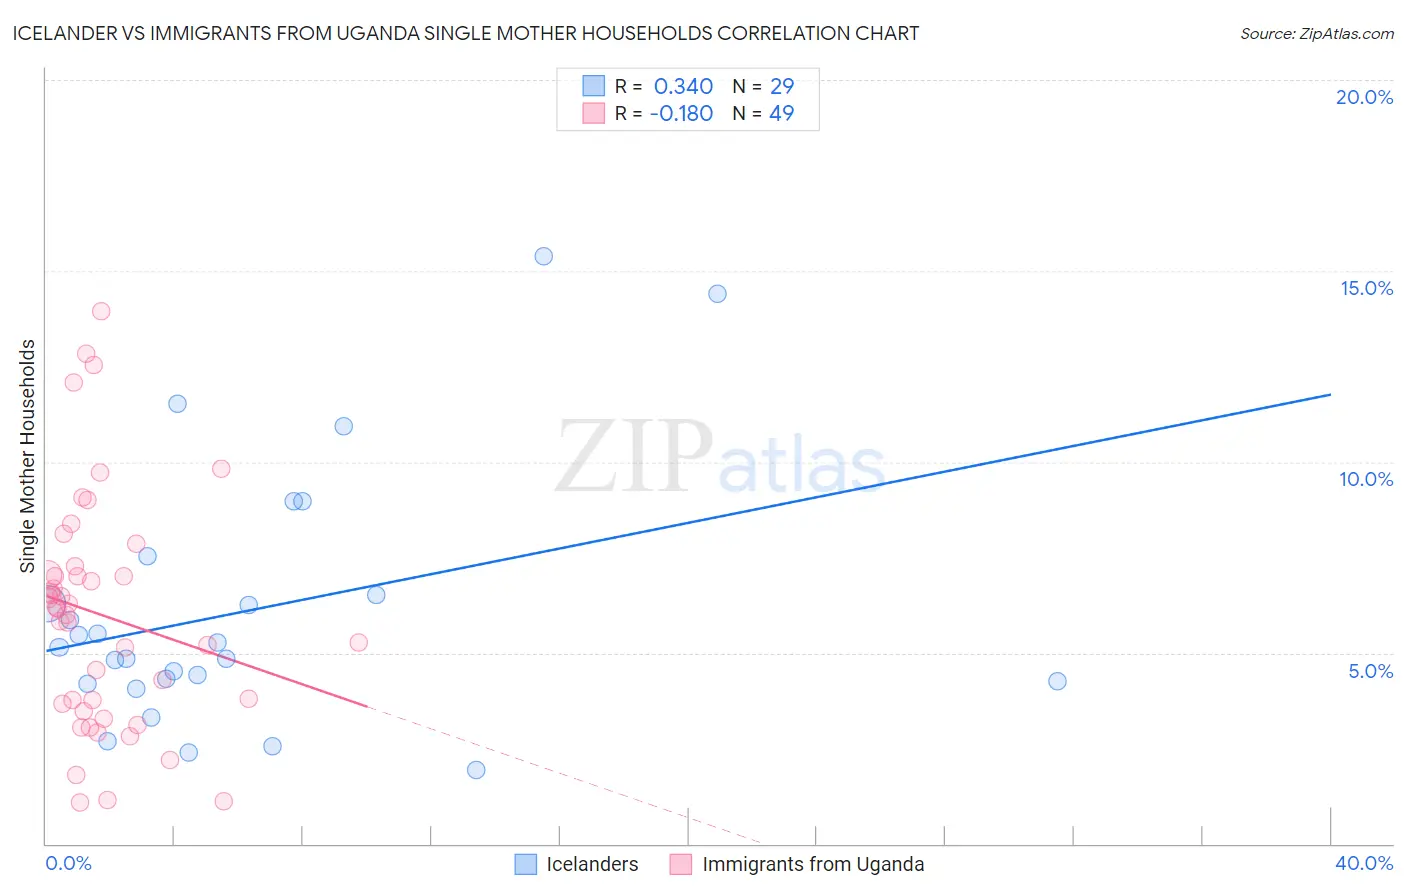
Icelander vs Immigrants from Uganda Single Mother Households Correlation Chart
The statistical analysis conducted on geographies consisting of 159,379,792 people shows a mild positive correlation between the proportion of Icelanders and percentage of single mother households in the United States with a correlation coefficient (R) of 0.340 and weighted average of 6.0%. Similarly, the statistical analysis conducted on geographies consisting of 125,934,931 people shows a poor negative correlation between the proportion of Immigrants from Uganda and percentage of single mother households in the United States with a correlation coefficient (R) of -0.180 and weighted average of 6.6%, a difference of 9.8%.
Single Mother Households Correlation Summary
| Measurement | Icelander | Immigrants from Uganda |
| Minimum | 1.9% | 1.1% |
| Maximum | 15.4% | 13.9% |
| Range | 13.5% | 12.8% |
| Mean | 6.1% | 6.0% |
| Median | 5.1% | 6.2% |
| Interquartile 25% (IQ1) | 4.2% | 3.6% |
| Interquartile 75% (IQ3) | 7.0% | 7.2% |
| Interquartile Range (IQR) | 2.8% | 3.6% |
| Standard Deviation (Sample) | 3.4% | 3.1% |
| Standard Deviation (Population) | 3.3% | 3.0% |
Similar Demographics by Single Mother Households
Demographics Similar to Icelanders by Single Mother Households
In terms of single mother households, the demographic groups most similar to Icelanders are Syrian (6.0%, a difference of 0.23%), French (6.0%, a difference of 0.30%), Tsimshian (6.0%, a difference of 0.40%), Immigrants from Pakistan (6.0%, a difference of 0.41%), and Immigrants from Egypt (6.0%, a difference of 0.45%).
| Demographics | Rating | Rank | Single Mother Households |
| Immigrants | Spain | 91.2 /100 | #131 | Exceptional 5.9% |
| Albanians | 91.1 /100 | #132 | Exceptional 5.9% |
| Egyptians | 90.7 /100 | #133 | Exceptional 5.9% |
| Canadians | 90.5 /100 | #134 | Exceptional 5.9% |
| Immigrants | Saudi Arabia | 90.2 /100 | #135 | Exceptional 5.9% |
| Jordanians | 88.9 /100 | #136 | Excellent 6.0% |
| Immigrants | Pakistan | 88.4 /100 | #137 | Excellent 6.0% |
| Icelanders | 86.9 /100 | #138 | Excellent 6.0% |
| Syrians | 86.0 /100 | #139 | Excellent 6.0% |
| French | 85.7 /100 | #140 | Excellent 6.0% |
| Tsimshian | 85.2 /100 | #141 | Excellent 6.0% |
| Immigrants | Egypt | 85.0 /100 | #142 | Excellent 6.0% |
| Immigrants | Iraq | 84.8 /100 | #143 | Excellent 6.0% |
| Koreans | 84.4 /100 | #144 | Excellent 6.0% |
| Arabs | 84.0 /100 | #145 | Excellent 6.0% |
Demographics Similar to Immigrants from Uganda by Single Mother Households
In terms of single mother households, the demographic groups most similar to Immigrants from Uganda are Colombian (6.6%, a difference of 0.010%), South American (6.6%, a difference of 0.050%), Uruguayan (6.6%, a difference of 0.050%), American (6.6%, a difference of 0.12%), and Moroccan (6.6%, a difference of 0.15%).
| Demographics | Rating | Rank | Single Mother Households |
| Immigrants | Afghanistan | 24.7 /100 | #187 | Fair 6.5% |
| Ottawa | 23.8 /100 | #188 | Fair 6.5% |
| Delaware | 23.3 /100 | #189 | Fair 6.5% |
| Peruvians | 21.6 /100 | #190 | Fair 6.5% |
| Samoans | 21.2 /100 | #191 | Fair 6.5% |
| Americans | 19.0 /100 | #192 | Poor 6.6% |
| Colombians | 18.3 /100 | #193 | Poor 6.6% |
| Immigrants | Uganda | 18.3 /100 | #194 | Poor 6.6% |
| South Americans | 18.0 /100 | #195 | Poor 6.6% |
| Uruguayans | 18.0 /100 | #196 | Poor 6.6% |
| Moroccans | 17.4 /100 | #197 | Poor 6.6% |
| Hawaiians | 16.1 /100 | #198 | Poor 6.6% |
| Potawatomi | 15.5 /100 | #199 | Poor 6.6% |
| Immigrants | Ethiopia | 14.7 /100 | #200 | Poor 6.6% |
| Venezuelans | 12.9 /100 | #201 | Poor 6.6% |