Hungarian vs Syrian 10th Grade

COMPARE

Hungarian
Race
Ancestry
AfghanAfricanAlaska NativeAlaskan AthabascanAlbanianAleutAlsatianAmericanApacheArabArapahoArgentineanArmenianAssyrian/Chaldean/SyriacAustralianAustrianBahamianBangladeshiBarbadianBasqueBelgianBelizeanBermudanBhutaneseBlackfeetBolivianBrazilianBritishBritish West IndianBulgarianBurmeseCajunCambodianCanadianCape VerdeanCarpatho RusynCelticCentral AmericanCentral American IndianCherokeeCheyenneChickasawChileanChineseChippewaChoctawColombianColvilleComancheCosta RicanCreeCreekCroatianCrowCubanCypriotCzechCzechoslovakianDanishDelawareDominicanDutchDutch West IndianEastern EuropeanEcuadorianEgyptianEnglishEstonianEthiopianEuropeanFijianFilipinoFinnishFrenchFrench American IndianFrench CanadianGermanGerman RussianGhanaianGreekGuamanian/ChamorroGuatemalanGuyaneseHaitianHmongHonduranHopiHoumaHungarianIcelanderIndian (Asian)IndonesianInupiatIranianIraqiIrishIroquoisIsraeliItalianJamaicanJapaneseJordanianKenyanKiowaKoreanLaotianLatvianLebaneseLiberianLithuanianLumbeeLuxembourgerMacedonianMalaysianMalteseMarshalleseMenomineeMexicanMexican American IndianMongolianMoroccanNative HawaiianNavajoNepaleseNew ZealanderNicaraguanNigerianNorthern EuropeanNorwegianOkinawanOsageOttawaPaiutePakistaniPalestinianPanamanianParaguayanPennsylvania GermanPeruvianPimaPolishPortuguesePotawatomiPuebloPuerto RicanPuget Sound SalishRomanianRussianSalvadoranSamoanScandinavianScotch-IrishScottishSeminoleSenegaleseSerbianShoshoneSierra LeoneanSiouxSlavicSlovakSloveneSomaliSouth AfricanSouth AmericanSouth American IndianSoviet UnionSpaniardSpanishSpanish AmericanSpanish American IndianSri LankanSubsaharan AfricanSudaneseSwedishSwissTaiwaneseThaiTlingit-HaidaTohono O'OdhamTonganTrinidadian and TobagonianTsimshianTurkishU.S. Virgin IslanderUgandanUkrainianUruguayanUteVenezuelanVietnameseWelshWest IndianYakamaYaquiYugoslavianYumanYup'ikZimbabwean
Immigration
NonimmigrantsImmigrantsAfghanistanAfricaAlbaniaArgentinaArmeniaAsiaAustraliaAustriaBahamasBangladeshBarbadosBelarusBelgiumBelizeBoliviaBosnia and HerzegovinaBrazilBulgariaBurma/MyanmarCabo VerdeCambodiaCameroonCanadaCaribbeanCentral AmericaChileChinaColombiaCongoCosta RicaCroatiaCubaCzechoslovakiaDenmarkDominicaDominican RepublicEastern AfricaEastern AsiaEastern EuropeEcuadorEgyptEl SalvadorEnglandEritreaEthiopiaEuropeFijiFranceGermanyGhanaGreeceGrenadaGuatemalaGuyanaHaitiHondurasHong KongHungaryIndiaIndonesiaIranIraqIrelandIsraelItalyJamaicaJapanJordanKazakhstanKenyaKoreaKuwaitLaosLatin AmericaLatviaLebanonLiberiaLithuaniaMalaysiaMexicoMicronesiaMiddle AfricaMoldovaMoroccoNepalNetherlandsNicaraguaNigeriaNorth AmericaNorth MacedoniaNorthern AfricaNorthern EuropeNorwayOceaniaPakistanPanamaPeruPhilippinesPolandPortugalRomaniaRussiaSaudi ArabiaScotlandSenegalSerbiaSierra LeoneSingaporeSomaliaSouth AfricaSouth AmericaSouth Central AsiaSouth Eastern AsiaSouthern EuropeSpainSri LankaSt. Vincent and the GrenadinesSudanSwedenSwitzerlandSyriaTaiwanThailandTrinidad and TobagoTurkeyUgandaUkraineUruguayUzbekistanVenezuelaVietnamWest IndiesWestern AfricaWestern AsiaWestern EuropeYemenZaireZimbabweAzores
Syrian
Race
Ancestry
AfghanAfricanAlaska NativeAlaskan AthabascanAlbanianAleutAlsatianAmericanApacheArabArapahoArgentineanArmenianAssyrian/Chaldean/SyriacAustralianAustrianBahamianBangladeshiBarbadianBasqueBelgianBelizeanBermudanBhutaneseBlackfeetBolivianBrazilianBritishBritish West IndianBulgarianBurmeseCajunCambodianCanadianCape VerdeanCarpatho RusynCelticCentral AmericanCentral American IndianCherokeeCheyenneChickasawChileanChineseChippewaChoctawColombianColvilleComancheCosta RicanCreeCreekCroatianCrowCubanCypriotCzechCzechoslovakianDanishDelawareDominicanDutchDutch West IndianEastern EuropeanEcuadorianEgyptianEnglishEstonianEthiopianEuropeanFijianFilipinoFinnishFrenchFrench American IndianFrench CanadianGermanGerman RussianGhanaianGreekGuamanian/ChamorroGuatemalanGuyaneseHaitianHmongHonduranHopiHoumaIcelanderIndian (Asian)IndonesianInupiatIranianIraqiIrishIroquoisIsraeliItalianJamaicanJapaneseJordanianKenyanKiowaKoreanLaotianLatvianLebaneseLiberianLithuanianLumbeeLuxembourgerMacedonianMalaysianMalteseMarshalleseMenomineeMexicanMexican American IndianMongolianMoroccanNative HawaiianNavajoNepaleseNew ZealanderNicaraguanNigerianNorthern EuropeanNorwegianOkinawanOsageOttawaPaiutePakistaniPalestinianPanamanianParaguayanPennsylvania GermanPeruvianPimaPolishPortuguesePotawatomiPuebloPuerto RicanPuget Sound SalishRomanianRussianSalvadoranSamoanScandinavianScotch-IrishScottishSeminoleSenegaleseSerbianShoshoneSierra LeoneanSiouxSlavicSlovakSloveneSomaliSouth AfricanSouth AmericanSouth American IndianSoviet UnionSpaniardSpanishSpanish AmericanSpanish American IndianSri LankanSubsaharan AfricanSudaneseSwedishSwissSyrianTaiwaneseThaiTlingit-HaidaTohono O'OdhamTonganTrinidadian and TobagonianTsimshianTurkishU.S. Virgin IslanderUgandanUkrainianUruguayanUteVenezuelanVietnameseWelshWest IndianYakamaYaquiYugoslavianYumanYup'ikZimbabwean
Immigration
NonimmigrantsImmigrantsAfghanistanAfricaAlbaniaArgentinaArmeniaAsiaAustraliaAustriaBahamasBangladeshBarbadosBelarusBelgiumBelizeBoliviaBosnia and HerzegovinaBrazilBulgariaBurma/MyanmarCabo VerdeCambodiaCameroonCanadaCaribbeanCentral AmericaChileChinaColombiaCongoCosta RicaCroatiaCubaCzechoslovakiaDenmarkDominicaDominican RepublicEastern AfricaEastern AsiaEastern EuropeEcuadorEgyptEl SalvadorEnglandEritreaEthiopiaEuropeFijiFranceGermanyGhanaGreeceGrenadaGuatemalaGuyanaHaitiHondurasHong KongHungaryIndiaIndonesiaIranIraqIrelandIsraelItalyJamaicaJapanJordanKazakhstanKenyaKoreaKuwaitLaosLatin AmericaLatviaLebanonLiberiaLithuaniaMalaysiaMexicoMicronesiaMiddle AfricaMoldovaMoroccoNepalNetherlandsNicaraguaNigeriaNorth AmericaNorth MacedoniaNorthern AfricaNorthern EuropeNorwayOceaniaPakistanPanamaPeruPhilippinesPolandPortugalRomaniaRussiaSaudi ArabiaScotlandSenegalSerbiaSierra LeoneSingaporeSomaliaSouth AfricaSouth AmericaSouth Central AsiaSouth Eastern AsiaSouthern EuropeSpainSri LankaSt. Vincent and the GrenadinesSudanSwedenSwitzerlandSyriaTaiwanThailandTrinidad and TobagoTurkeyUgandaUkraineUruguayUzbekistanVenezuelaVietnamWest IndiesWestern AfricaWestern AsiaWestern EuropeYemenZaireZimbabweAzores
10th Grade
Income
Poverty
Unemployment
Labor Participation
Family Structure
Vehicle Availability
Education Level
Disability

10th Grade Comparison

Hungarians

Syrians

Exceptional
Exceptional
95.3%
10TH GRADE
100.0/ 100
METRIC RATING
32nd/ 347
METRIC RANK
94.5%
10TH GRADE
97.7/ 100
METRIC RATING
101st/ 347
METRIC RANK

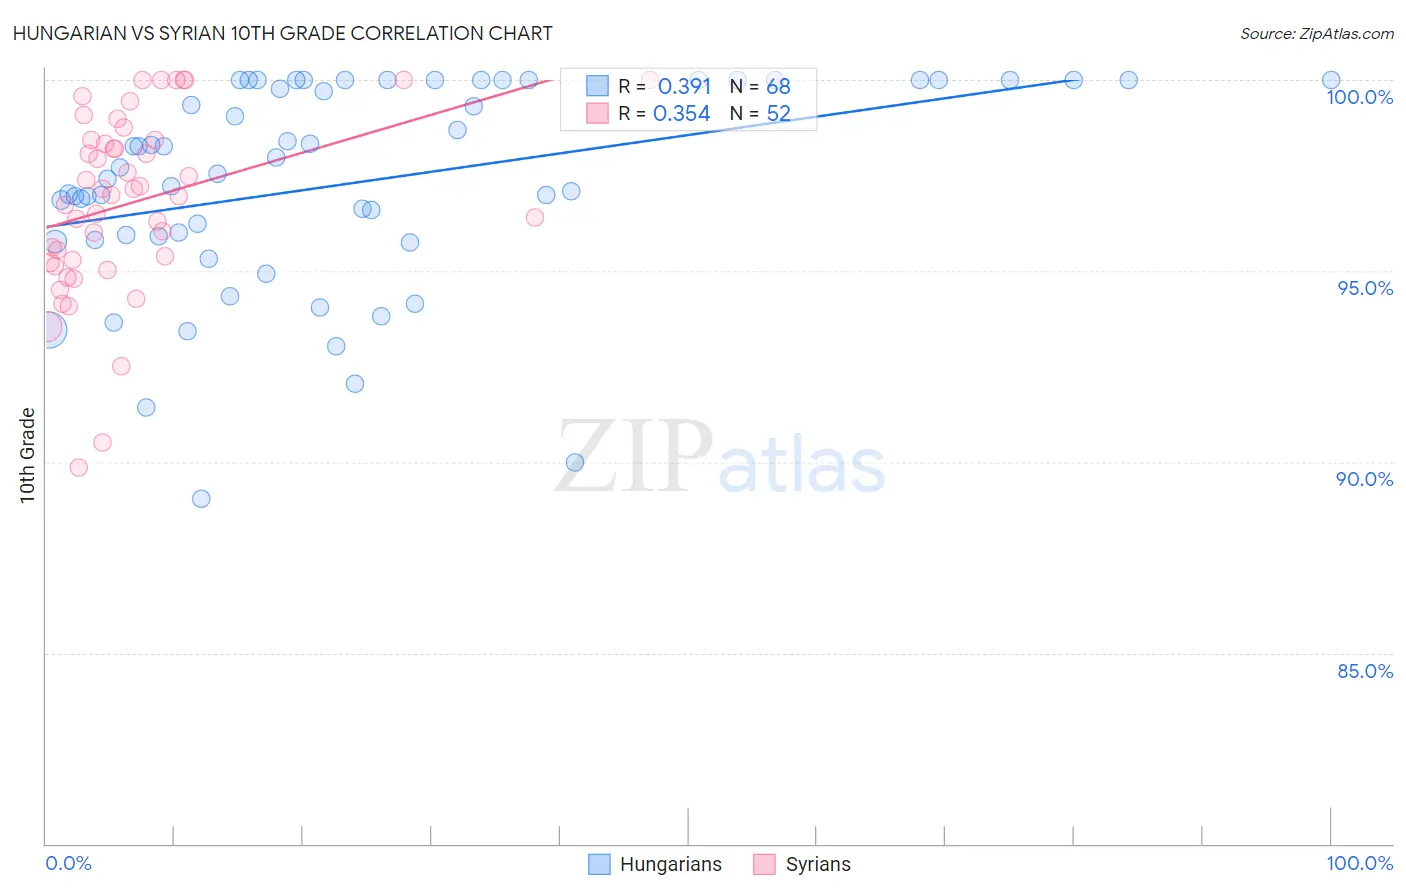
Hungarian vs Syrian 10th Grade Correlation Chart

The statistical analysis conducted on geographies consisting of 486,239,864 people shows a mild positive correlation between the proportion of Hungarians and percentage of population with at least 10th grade education in the United States with a correlation coefficient (R) of 0.391 and weighted average of 95.3%. Similarly, the statistical analysis conducted on geographies consisting of 266,305,988 people shows a mild positive correlation between the proportion of Syrians and percentage of population with at least 10th grade education in the United States with a correlation coefficient (R) of 0.354 and weighted average of 94.5%, a difference of 0.86%.
Hungarian vs Syrian 10th Grade

10th Grade Correlation Summary

MeasurementHungarianSyrian
Minimum89.0%89.8%
Maximum100.0%100.0%
Range11.0%10.2%
Mean97.3%96.8%
Median97.6%97.1%
Interquartile 25% (IQ1)95.9%95.3%
Interquartile 75% (IQ3)100.0%98.4%
Interquartile Range (IQR)4.1%3.2%
Standard Deviation (Sample)2.7%2.4%
Standard Deviation (Population)2.7%2.3%

Similar Demographics by 10th Grade

Demographics Similar to Hungarians by 10th Grade

In terms of 10th grade, the demographic groups most similar to Hungarians are Iranian (95.3%, a difference of 0.0%), French (95.3%, a difference of 0.0%), British (95.3%, a difference of 0.010%), Belgian (95.4%, a difference of 0.020%), and Estonian (95.3%, a difference of 0.020%).
DemographicsRating | Rank10th Grade
Maltese
100.0
/100
|
#25
Exceptional
95.5%
Welsh
100.0
/100
|
#26
Exceptional
95.5%
Alaskan Athabascans
100.0
/100
|
#27
Exceptional
95.4%
Luxembourgers
100.0
/100
|
#28
Exceptional
95.4%
Bulgarians
100.0
/100
|
#29
Exceptional
95.4%
Belgians
100.0
/100
|
#30
Exceptional
95.4%
Iranians
100.0
/100
|
#31
Exceptional
95.3%
Hungarians
100.0
/100
|
#32
Exceptional
95.3%
French
100.0
/100
|
#33
Exceptional
95.3%
British
99.9
/100
|
#34
Exceptional
95.3%
Estonians
99.9
/100
|
#35
Exceptional
95.3%
Immigrants | India
99.9
/100
|
#36
Exceptional
95.3%
French Canadians
99.9
/100
|
#37
Exceptional
95.3%
Northern Europeans
99.9
/100
|
#38
Exceptional
95.3%
Immigrants | Scotland
99.9
/100
|
#39
Exceptional
95.2%

Demographics Similar to Syrians by 10th Grade

In terms of 10th grade, the demographic groups most similar to Syrians are Immigrants from South Central Asia (94.5%, a difference of 0.0%), Cambodian (94.5%, a difference of 0.010%), Immigrants from France (94.5%, a difference of 0.020%), Immigrants from Europe (94.5%, a difference of 0.020%), and Immigrants from Romania (94.5%, a difference of 0.020%).
DemographicsRating | Rank10th Grade
Immigrants | Germany
98.3
/100
|
#94
Exceptional
94.6%
Menominee
98.3
/100
|
#95
Exceptional
94.6%
Immigrants | Switzerland
98.3
/100
|
#96
Exceptional
94.6%
Lebanese
98.3
/100
|
#97
Exceptional
94.6%
Immigrants | Bulgaria
98.1
/100
|
#98
Exceptional
94.6%
Immigrants | France
97.9
/100
|
#99
Exceptional
94.5%
Immigrants | South Central Asia
97.8
/100
|
#100
Exceptional
94.5%
Syrians
97.7
/100
|
#101
Exceptional
94.5%
Cambodians
97.6
/100
|
#102
Exceptional
94.5%
Immigrants | Europe
97.5
/100
|
#103
Exceptional
94.5%
Immigrants | Romania
97.5
/100
|
#104
Exceptional
94.5%
Immigrants | Turkey
97.4
/100
|
#105
Exceptional
94.5%
Immigrants | Serbia
97.4
/100
|
#106
Exceptional
94.5%
Immigrants | Croatia
97.4
/100
|
#107
Exceptional
94.5%
Immigrants | North Macedonia
97.2
/100
|
#108
Exceptional
94.5%