Hungarian vs Lebanese Single Mother Households
COMPARE
Hungarian
Lebanese
Single Mother Households
Single Mother Households Comparison
Hungarians
Lebanese
5.7%
SINGLE MOTHER HOUSEHOLDS
97.6/ 100
METRIC RATING
85th/ 347
METRIC RANK
5.9%
SINGLE MOTHER HOUSEHOLDS
92.4/ 100
METRIC RATING
127th/ 347
METRIC RANK
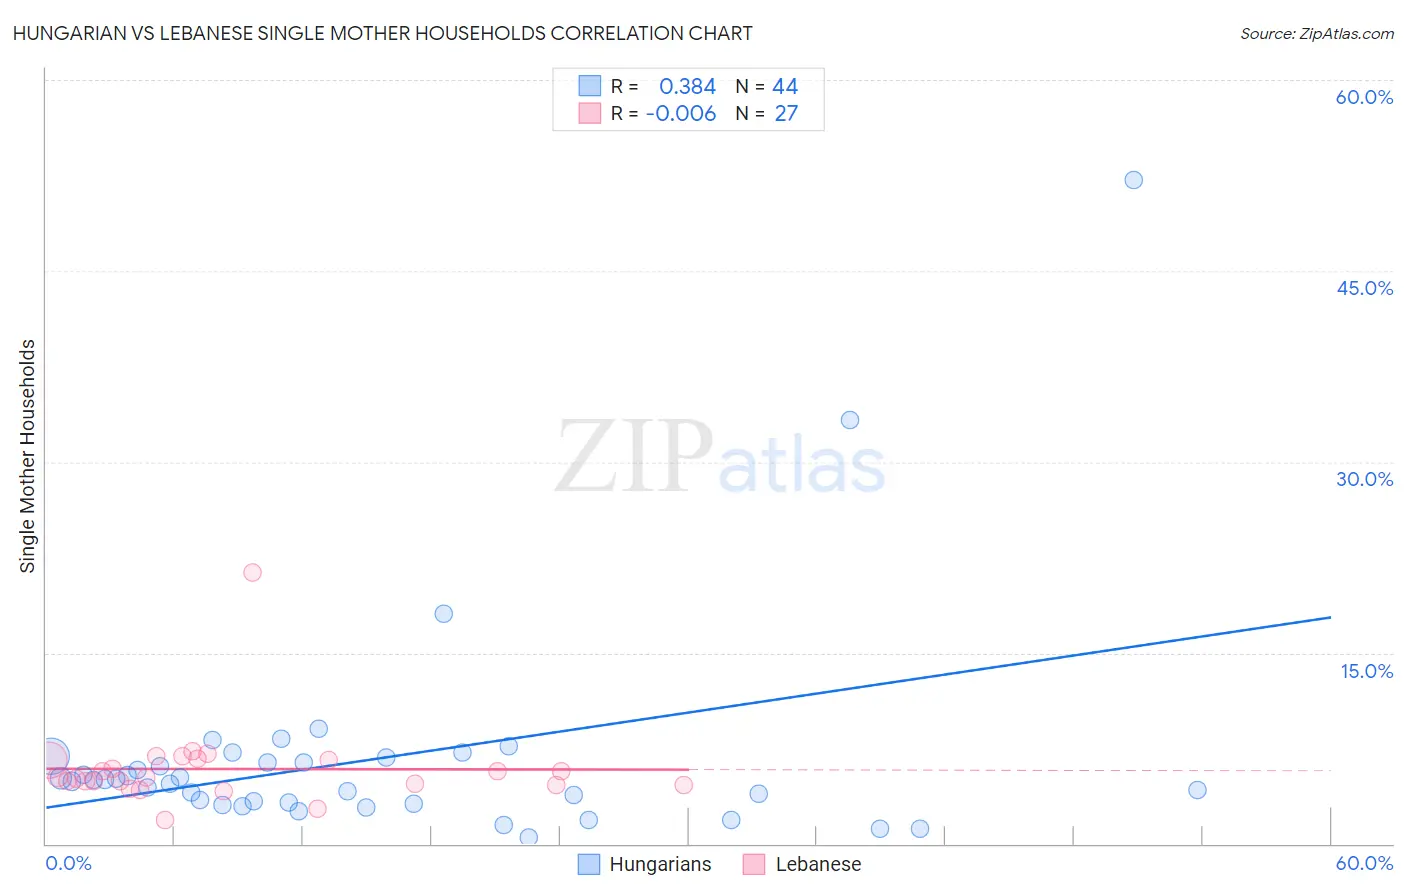
Hungarian vs Lebanese Single Mother Households Correlation Chart
The statistical analysis conducted on geographies consisting of 483,597,168 people shows a mild positive correlation between the proportion of Hungarians and percentage of single mother households in the United States with a correlation coefficient (R) of 0.384 and weighted average of 5.7%. Similarly, the statistical analysis conducted on geographies consisting of 400,403,260 people shows no correlation between the proportion of Lebanese and percentage of single mother households in the United States with a correlation coefficient (R) of -0.006 and weighted average of 5.9%, a difference of 3.6%.
Single Mother Households Correlation Summary
| Measurement | Hungarian | Lebanese |
| Minimum | 0.48% | 1.9% |
| Maximum | 52.2% | 21.3% |
| Range | 51.7% | 19.4% |
| Mean | 6.6% | 5.9% |
| Median | 4.9% | 5.2% |
| Interquartile 25% (IQ1) | 3.2% | 4.6% |
| Interquartile 75% (IQ3) | 6.6% | 6.6% |
| Interquartile Range (IQR) | 3.4% | 2.0% |
| Standard Deviation (Sample) | 8.7% | 3.3% |
| Standard Deviation (Population) | 8.6% | 3.3% |
Similar Demographics by Single Mother Households
Demographics Similar to Hungarians by Single Mother Households
In terms of single mother households, the demographic groups most similar to Hungarians are Finnish (5.7%, a difference of 0.030%), Immigrants from Turkey (5.7%, a difference of 0.11%), Carpatho Rusyn (5.7%, a difference of 0.15%), Israeli (5.7%, a difference of 0.18%), and Immigrants from Hungary (5.7%, a difference of 0.23%).
| Demographics | Rating | Rank | Single Mother Households |
| Swiss | 98.1 /100 | #78 | Exceptional 5.6% |
| Immigrants | Sri Lanka | 98.0 /100 | #79 | Exceptional 5.6% |
| Czechs | 97.9 /100 | #80 | Exceptional 5.6% |
| Immigrants | Moldova | 97.9 /100 | #81 | Exceptional 5.6% |
| Immigrants | Malaysia | 97.8 /100 | #82 | Exceptional 5.7% |
| Immigrants | Hungary | 97.8 /100 | #83 | Exceptional 5.7% |
| Carpatho Rusyns | 97.7 /100 | #84 | Exceptional 5.7% |
| Hungarians | 97.6 /100 | #85 | Exceptional 5.7% |
| Finns | 97.6 /100 | #86 | Exceptional 5.7% |
| Immigrants | Turkey | 97.5 /100 | #87 | Exceptional 5.7% |
| Israelis | 97.4 /100 | #88 | Exceptional 5.7% |
| Ukrainians | 97.2 /100 | #89 | Exceptional 5.7% |
| Immigrants | Indonesia | 97.2 /100 | #90 | Exceptional 5.7% |
| Europeans | 97.0 /100 | #91 | Exceptional 5.7% |
| Immigrants | Western Asia | 96.7 /100 | #92 | Exceptional 5.7% |
Demographics Similar to Lebanese by Single Mother Households
In terms of single mother households, the demographic groups most similar to Lebanese are Czechoslovakian (5.9%, a difference of 0.080%), Immigrants from Bolivia (5.9%, a difference of 0.090%), Palestinian (5.9%, a difference of 0.12%), Welsh (5.9%, a difference of 0.19%), and Slavic (5.9%, a difference of 0.21%).
| Demographics | Rating | Rank | Single Mother Households |
| Tongans | 93.7 /100 | #120 | Exceptional 5.8% |
| Argentineans | 93.7 /100 | #121 | Exceptional 5.8% |
| Belgians | 93.5 /100 | #122 | Exceptional 5.8% |
| Immigrants | Uzbekistan | 93.4 /100 | #123 | Exceptional 5.9% |
| Immigrants | Argentina | 93.2 /100 | #124 | Exceptional 5.9% |
| Slavs | 92.9 /100 | #125 | Exceptional 5.9% |
| Welsh | 92.8 /100 | #126 | Exceptional 5.9% |
| Lebanese | 92.4 /100 | #127 | Exceptional 5.9% |
| Czechoslovakians | 92.2 /100 | #128 | Exceptional 5.9% |
| Immigrants | Bolivia | 92.2 /100 | #129 | Exceptional 5.9% |
| Palestinians | 92.1 /100 | #130 | Exceptional 5.9% |
| Immigrants | Spain | 91.2 /100 | #131 | Exceptional 5.9% |
| Albanians | 91.1 /100 | #132 | Exceptional 5.9% |
| Egyptians | 90.7 /100 | #133 | Exceptional 5.9% |
| Canadians | 90.5 /100 | #134 | Exceptional 5.9% |