Houma vs American Family Households with Children
COMPARE
Houma
American
Family Households with Children
Family Households with Children Comparison
Houma
Americans
28.5%
FAMILY HOUSEHOLDS WITH CHILDREN
99.9/ 100
METRIC RATING
68th/ 347
METRIC RANK
27.3%
FAMILY HOUSEHOLDS WITH CHILDREN
22.8/ 100
METRIC RATING
202nd/ 347
METRIC RANK
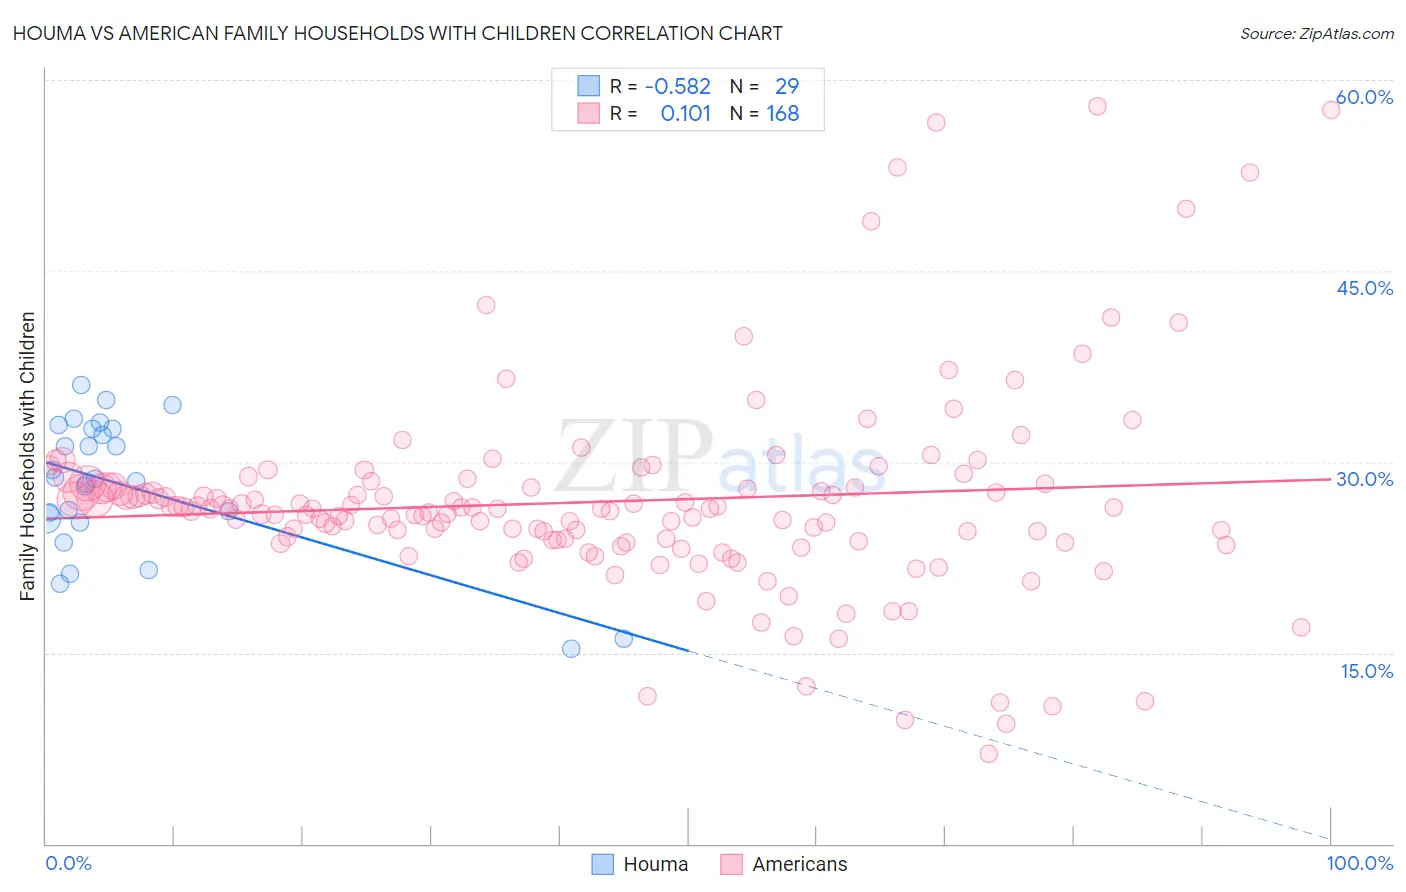
Houma vs American Family Households with Children Correlation Chart
The statistical analysis conducted on geographies consisting of 36,792,477 people shows a substantial negative correlation between the proportion of Houma and percentage of family households with children in the United States with a correlation coefficient (R) of -0.582 and weighted average of 28.5%. Similarly, the statistical analysis conducted on geographies consisting of 580,876,887 people shows a poor positive correlation between the proportion of Americans and percentage of family households with children in the United States with a correlation coefficient (R) of 0.101 and weighted average of 27.3%, a difference of 4.6%.
Family Households with Children Correlation Summary
| Measurement | Houma | American |
| Minimum | 15.3% | 7.1% |
| Maximum | 36.0% | 57.9% |
| Range | 20.7% | 50.8% |
| Mean | 28.1% | 26.9% |
| Median | 28.7% | 26.3% |
| Interquartile 25% (IQ1) | 25.4% | 23.8% |
| Interquartile 75% (IQ3) | 32.6% | 28.0% |
| Interquartile Range (IQR) | 7.3% | 4.2% |
| Standard Deviation (Sample) | 5.4% | 7.9% |
| Standard Deviation (Population) | 5.3% | 7.9% |
Similar Demographics by Family Households with Children
Demographics Similar to Houma by Family Households with Children
In terms of family households with children, the demographic groups most similar to Houma are Honduran (28.5%, a difference of 0.020%), Immigrants from Egypt (28.5%, a difference of 0.020%), Ghanaian (28.5%, a difference of 0.020%), Immigrants from Korea (28.5%, a difference of 0.020%), and Immigrants from Honduras (28.5%, a difference of 0.070%).
| Demographics | Rating | Rank | Family Households with Children |
| Immigrants | Ghana | 99.9 /100 | #61 | Exceptional 28.6% |
| Egyptians | 99.9 /100 | #62 | Exceptional 28.6% |
| Immigrants | Lebanon | 99.9 /100 | #63 | Exceptional 28.6% |
| Filipinos | 99.9 /100 | #64 | Exceptional 28.6% |
| Hondurans | 99.9 /100 | #65 | Exceptional 28.5% |
| Immigrants | Egypt | 99.9 /100 | #66 | Exceptional 28.5% |
| Ghanaians | 99.9 /100 | #67 | Exceptional 28.5% |
| Houma | 99.9 /100 | #68 | Exceptional 28.5% |
| Immigrants | Korea | 99.9 /100 | #69 | Exceptional 28.5% |
| Immigrants | Honduras | 99.9 /100 | #70 | Exceptional 28.5% |
| Burmese | 99.9 /100 | #71 | Exceptional 28.5% |
| Immigrants | Indonesia | 99.9 /100 | #72 | Exceptional 28.5% |
| Iraqis | 99.9 /100 | #73 | Exceptional 28.5% |
| Laotians | 99.9 /100 | #74 | Exceptional 28.5% |
| Immigrants | Jordan | 99.9 /100 | #75 | Exceptional 28.4% |
Demographics Similar to Americans by Family Households with Children
In terms of family households with children, the demographic groups most similar to Americans are Kiowa (27.3%, a difference of 0.020%), Immigrants from Sudan (27.3%, a difference of 0.040%), Bhutanese (27.3%, a difference of 0.070%), Immigrants from Haiti (27.2%, a difference of 0.080%), and Immigrants from Micronesia (27.2%, a difference of 0.090%).
| Demographics | Rating | Rank | Family Households with Children |
| Crow | 35.7 /100 | #195 | Fair 27.4% |
| Cheyenne | 35.1 /100 | #196 | Fair 27.4% |
| Norwegians | 35.0 /100 | #197 | Fair 27.4% |
| Immigrants | Romania | 34.4 /100 | #198 | Fair 27.4% |
| English | 32.0 /100 | #199 | Fair 27.3% |
| Immigrants | Congo | 28.7 /100 | #200 | Fair 27.3% |
| Bhutanese | 25.1 /100 | #201 | Fair 27.3% |
| Americans | 22.8 /100 | #202 | Fair 27.3% |
| Kiowa | 22.2 /100 | #203 | Fair 27.3% |
| Immigrants | Sudan | 21.6 /100 | #204 | Fair 27.3% |
| Immigrants | Haiti | 20.3 /100 | #205 | Fair 27.2% |
| Immigrants | Micronesia | 20.2 /100 | #206 | Fair 27.2% |
| Haitians | 19.8 /100 | #207 | Poor 27.2% |
| Immigrants | Poland | 16.4 /100 | #208 | Poor 27.2% |
| Dutch West Indians | 15.8 /100 | #209 | Poor 27.2% |