Immigrants from St. Vincent and the Grenadines vs German Russian Family Households with Children
COMPARE
Immigrants from St. Vincent and the Grenadines
German Russian
Family Households with Children
Family Households with Children Comparison
Immigrants from St. Vincent and the Grenadines
German Russians
25.6%
FAMILY HOUSEHOLDS WITH CHILDREN
0.0/ 100
METRIC RATING
339th/ 347
METRIC RANK
26.8%
FAMILY HOUSEHOLDS WITH CHILDREN
1.5/ 100
METRIC RATING
255th/ 347
METRIC RANK
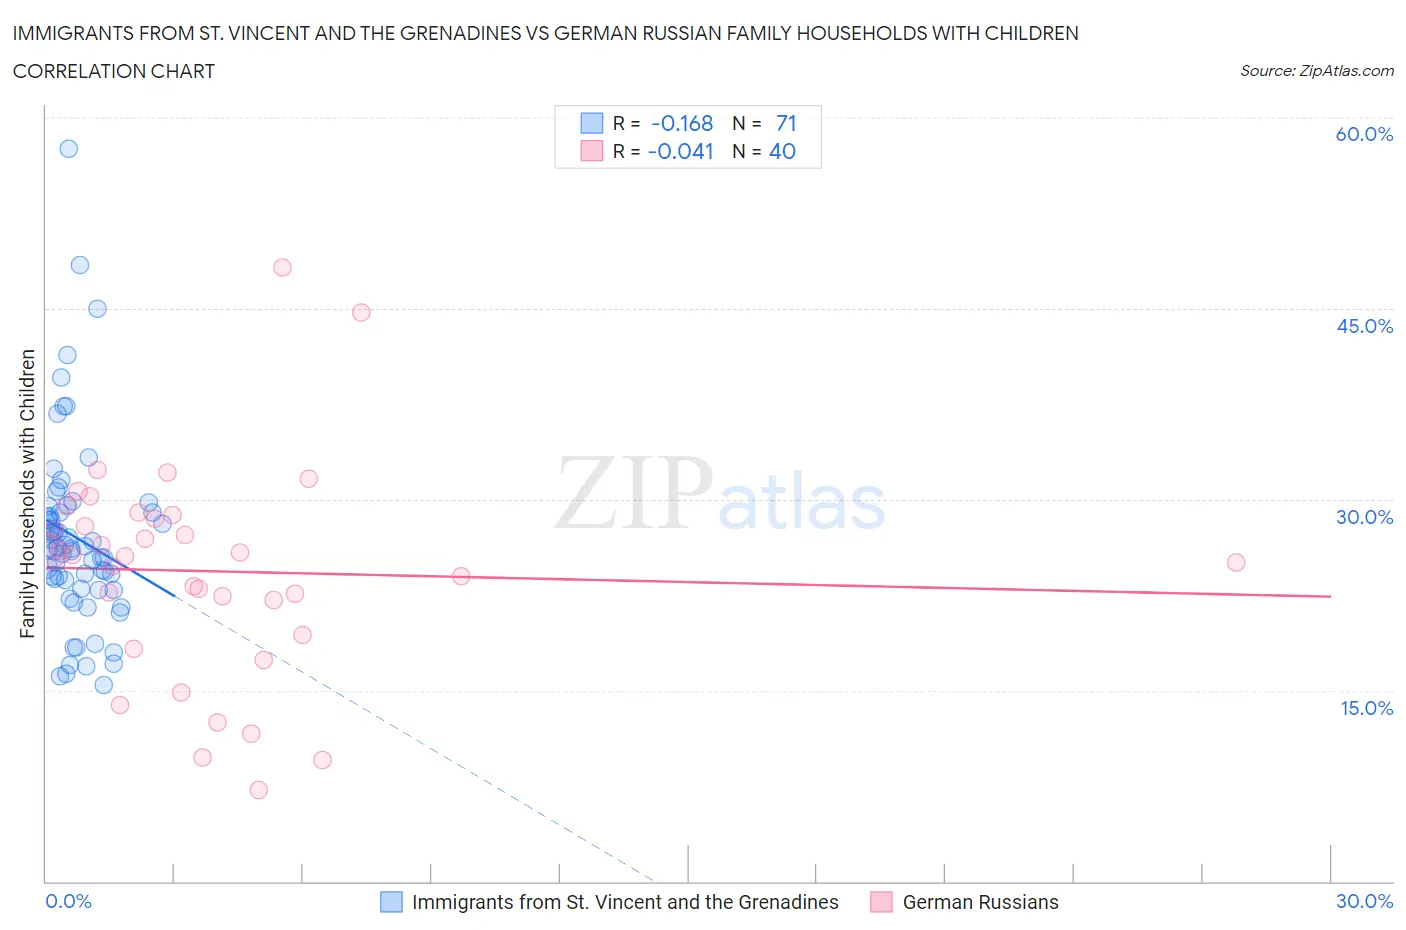
Immigrants from St. Vincent and the Grenadines vs German Russian Family Households with Children Correlation Chart
The statistical analysis conducted on geographies consisting of 56,180,782 people shows a poor negative correlation between the proportion of Immigrants from St. Vincent and the Grenadines and percentage of family households with children in the United States with a correlation coefficient (R) of -0.168 and weighted average of 25.6%. Similarly, the statistical analysis conducted on geographies consisting of 96,442,482 people shows no correlation between the proportion of German Russians and percentage of family households with children in the United States with a correlation coefficient (R) of -0.041 and weighted average of 26.8%, a difference of 4.9%.
Family Households with Children Correlation Summary
| Measurement | Immigrants from St. Vincent and the Grenadines | German Russian |
| Minimum | 15.4% | 7.2% |
| Maximum | 57.6% | 48.2% |
| Range | 42.2% | 41.0% |
| Mean | 27.0% | 24.4% |
| Median | 26.1% | 25.6% |
| Interquartile 25% (IQ1) | 23.0% | 20.7% |
| Interquartile 75% (IQ3) | 29.0% | 28.7% |
| Interquartile Range (IQR) | 6.0% | 7.9% |
| Standard Deviation (Sample) | 7.4% | 8.4% |
| Standard Deviation (Population) | 7.3% | 8.3% |
Similar Demographics by Family Households with Children
Demographics Similar to Immigrants from St. Vincent and the Grenadines by Family Households with Children
In terms of family households with children, the demographic groups most similar to Immigrants from St. Vincent and the Grenadines are Arapaho (25.6%, a difference of 0.010%), Puerto Rican (25.6%, a difference of 0.040%), Immigrants from Armenia (25.6%, a difference of 0.040%), Immigrants from Serbia (25.5%, a difference of 0.42%), and Immigrants from West Indies (25.7%, a difference of 0.43%).
| Demographics | Rating | Rank | Family Households with Children |
| Immigrants | Austria | 0.0 /100 | #332 | Tragic 25.8% |
| Immigrants | Switzerland | 0.0 /100 | #333 | Tragic 25.7% |
| Slovaks | 0.0 /100 | #334 | Tragic 25.7% |
| Immigrants | Croatia | 0.0 /100 | #335 | Tragic 25.7% |
| Immigrants | West Indies | 0.0 /100 | #336 | Tragic 25.7% |
| Puerto Ricans | 0.0 /100 | #337 | Tragic 25.6% |
| Arapaho | 0.0 /100 | #338 | Tragic 25.6% |
| Immigrants | St. Vincent and the Grenadines | 0.0 /100 | #339 | Tragic 25.6% |
| Immigrants | Armenia | 0.0 /100 | #340 | Tragic 25.6% |
| Immigrants | Serbia | 0.0 /100 | #341 | Tragic 25.5% |
| Alsatians | 0.0 /100 | #342 | Tragic 25.3% |
| Hopi | 0.0 /100 | #343 | Tragic 25.2% |
| Pueblo | 0.0 /100 | #344 | Tragic 25.2% |
| Immigrants | Grenada | 0.0 /100 | #345 | Tragic 25.2% |
| Carpatho Rusyns | 0.0 /100 | #346 | Tragic 25.2% |
Demographics Similar to German Russians by Family Households with Children
In terms of family households with children, the demographic groups most similar to German Russians are Immigrants from Scotland (26.8%, a difference of 0.0%), Scotch-Irish (26.8%, a difference of 0.010%), Italian (26.8%, a difference of 0.030%), Slavic (26.8%, a difference of 0.060%), and Immigrants from Cuba (26.8%, a difference of 0.070%).
| Demographics | Rating | Rank | Family Households with Children |
| Immigrants | Kazakhstan | 2.2 /100 | #248 | Tragic 26.9% |
| Immigrants | Eastern Europe | 2.1 /100 | #249 | Tragic 26.9% |
| Belgians | 2.1 /100 | #250 | Tragic 26.9% |
| Immigrants | Bosnia and Herzegovina | 1.9 /100 | #251 | Tragic 26.8% |
| Irish | 1.8 /100 | #252 | Tragic 26.8% |
| Italians | 1.5 /100 | #253 | Tragic 26.8% |
| Immigrants | Scotland | 1.5 /100 | #254 | Tragic 26.8% |
| German Russians | 1.5 /100 | #255 | Tragic 26.8% |
| Scotch-Irish | 1.4 /100 | #256 | Tragic 26.8% |
| Slavs | 1.3 /100 | #257 | Tragic 26.8% |
| Immigrants | Cuba | 1.3 /100 | #258 | Tragic 26.8% |
| Immigrants | Lithuania | 1.2 /100 | #259 | Tragic 26.8% |
| Immigrants | Jamaica | 1.2 /100 | #260 | Tragic 26.8% |
| Immigrants | Belarus | 1.1 /100 | #261 | Tragic 26.8% |
| Immigrants | Russia | 1.0 /100 | #262 | Tragic 26.8% |