Immigrants from Southern Europe vs German Russian Family Households with Children
COMPARE
Immigrants from Southern Europe
German Russian
Family Households with Children
Family Households with Children Comparison
Immigrants from Southern Europe
German Russians
26.9%
FAMILY HOUSEHOLDS WITH CHILDREN
3.4/ 100
METRIC RATING
239th/ 347
METRIC RANK
26.8%
FAMILY HOUSEHOLDS WITH CHILDREN
1.5/ 100
METRIC RATING
255th/ 347
METRIC RANK
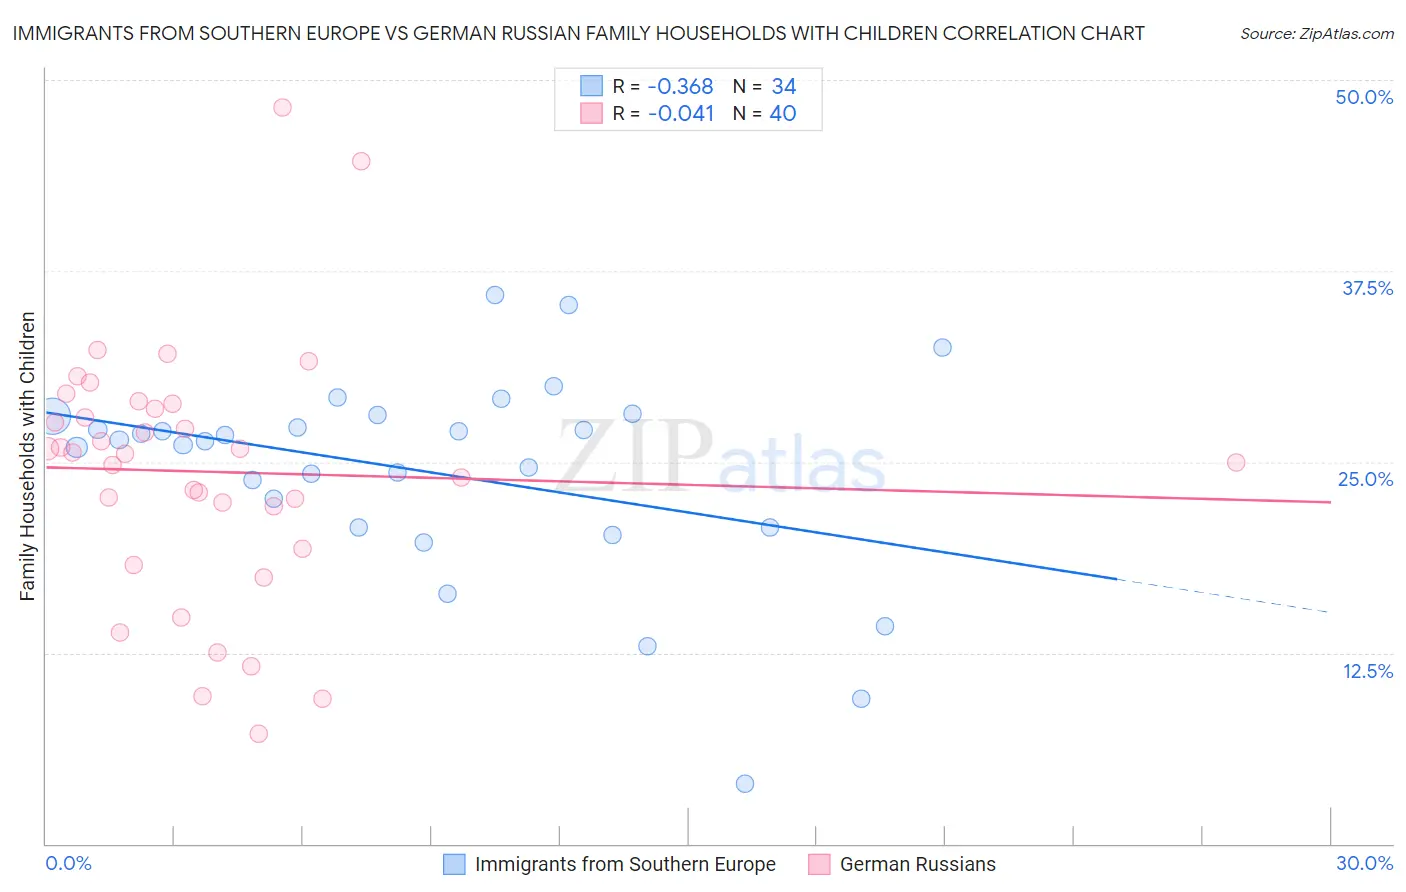
Immigrants from Southern Europe vs German Russian Family Households with Children Correlation Chart
The statistical analysis conducted on geographies consisting of 402,425,911 people shows a mild negative correlation between the proportion of Immigrants from Southern Europe and percentage of family households with children in the United States with a correlation coefficient (R) of -0.368 and weighted average of 26.9%. Similarly, the statistical analysis conducted on geographies consisting of 96,442,482 people shows no correlation between the proportion of German Russians and percentage of family households with children in the United States with a correlation coefficient (R) of -0.041 and weighted average of 26.8%, a difference of 0.48%.
Family Households with Children Correlation Summary
| Measurement | Immigrants from Southern Europe | German Russian |
| Minimum | 3.9% | 7.2% |
| Maximum | 35.9% | 48.2% |
| Range | 32.0% | 41.0% |
| Mean | 24.3% | 24.4% |
| Median | 26.4% | 25.6% |
| Interquartile 25% (IQ1) | 20.7% | 20.7% |
| Interquartile 75% (IQ3) | 28.0% | 28.7% |
| Interquartile Range (IQR) | 7.3% | 7.9% |
| Standard Deviation (Sample) | 6.8% | 8.4% |
| Standard Deviation (Population) | 6.7% | 8.3% |
Demographics Similar to Immigrants from Southern Europe and German Russians by Family Households with Children
In terms of family households with children, the demographic groups most similar to Immigrants from Southern Europe are Moroccan (26.9%, a difference of 0.010%), Immigrants from Netherlands (26.9%, a difference of 0.020%), Immigrants from Bulgaria (26.9%, a difference of 0.020%), Navajo (26.9%, a difference of 0.020%), and Immigrants from England (26.9%, a difference of 0.030%). Similarly, the demographic groups most similar to German Russians are Immigrants from Scotland (26.8%, a difference of 0.0%), Scotch-Irish (26.8%, a difference of 0.010%), Italian (26.8%, a difference of 0.030%), Slavic (26.8%, a difference of 0.060%), and Irish (26.8%, a difference of 0.11%).
| Demographics | Rating | Rank | Family Households with Children |
| Immigrants | Netherlands | 3.5 /100 | #237 | Tragic 26.9% |
| Moroccans | 3.4 /100 | #238 | Tragic 26.9% |
| Immigrants | Southern Europe | 3.4 /100 | #239 | Tragic 26.9% |
| Immigrants | Bulgaria | 3.3 /100 | #240 | Tragic 26.9% |
| Navajo | 3.2 /100 | #241 | Tragic 26.9% |
| Immigrants | England | 3.2 /100 | #242 | Tragic 26.9% |
| Immigrants | Saudi Arabia | 2.9 /100 | #243 | Tragic 26.9% |
| Ukrainians | 2.9 /100 | #244 | Tragic 26.9% |
| Australians | 2.8 /100 | #245 | Tragic 26.9% |
| Jamaicans | 2.5 /100 | #246 | Tragic 26.9% |
| Potawatomi | 2.2 /100 | #247 | Tragic 26.9% |
| Immigrants | Kazakhstan | 2.2 /100 | #248 | Tragic 26.9% |
| Immigrants | Eastern Europe | 2.1 /100 | #249 | Tragic 26.9% |
| Belgians | 2.1 /100 | #250 | Tragic 26.9% |
| Immigrants | Bosnia and Herzegovina | 1.9 /100 | #251 | Tragic 26.8% |
| Irish | 1.8 /100 | #252 | Tragic 26.8% |
| Italians | 1.5 /100 | #253 | Tragic 26.8% |
| Immigrants | Scotland | 1.5 /100 | #254 | Tragic 26.8% |
| German Russians | 1.5 /100 | #255 | Tragic 26.8% |
| Scotch-Irish | 1.4 /100 | #256 | Tragic 26.8% |
| Slavs | 1.3 /100 | #257 | Tragic 26.8% |