Immigrants from Micronesia vs Immigrants from Iran Divorced or Separated
COMPARE
Immigrants from Micronesia
Immigrants from Iran
Divorced or Separated
Divorced or Separated Comparison
Immigrants from Micronesia
Immigrants from Iran
12.7%
DIVORCED OR SEPARATED
0.3/ 100
METRIC RATING
273rd/ 347
METRIC RANK
10.6%
DIVORCED OR SEPARATED
100.0/ 100
METRIC RATING
18th/ 347
METRIC RANK
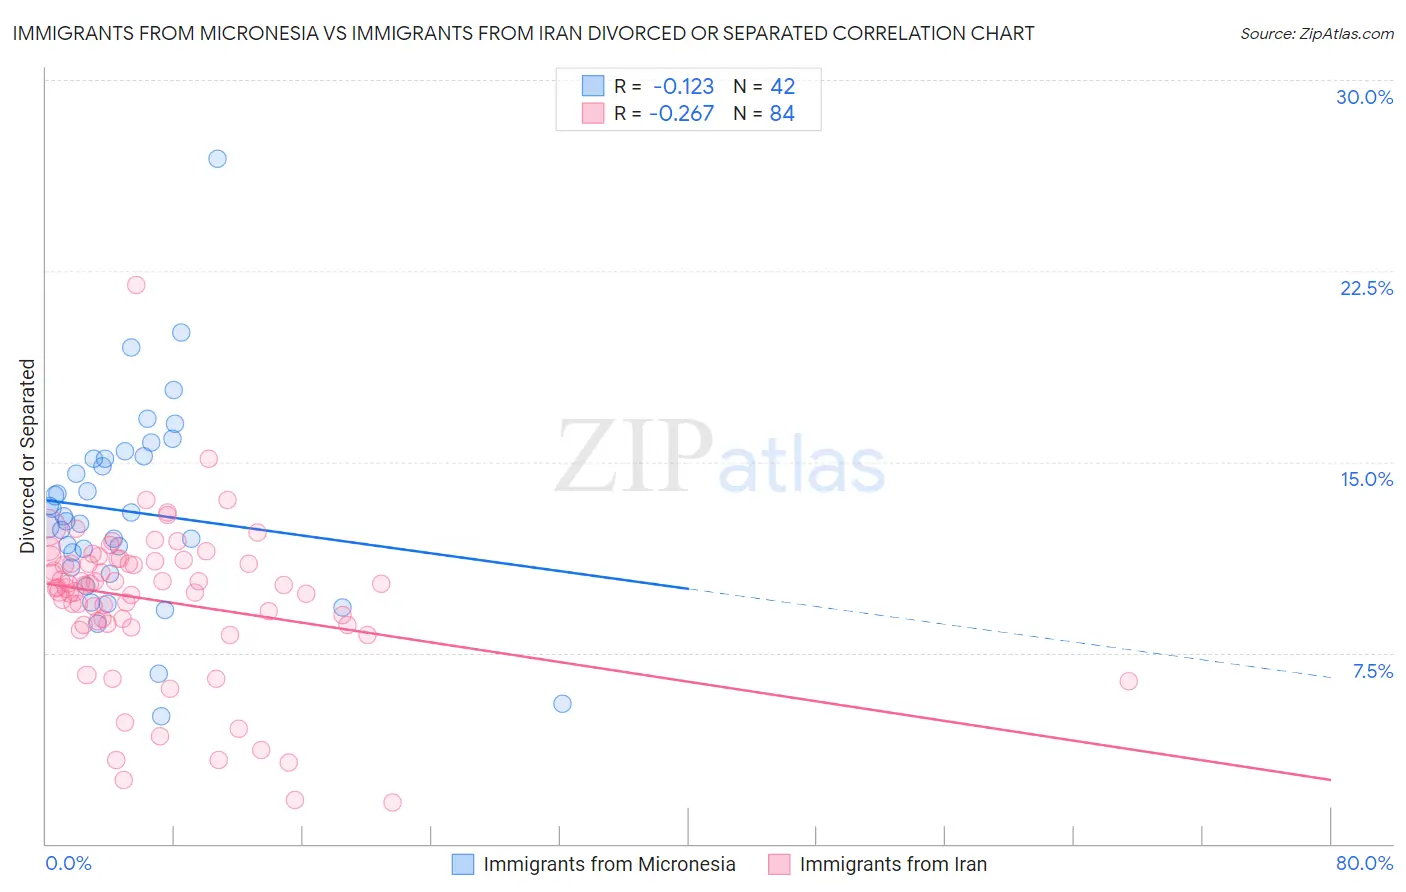
Immigrants from Micronesia vs Immigrants from Iran Divorced or Separated Correlation Chart
The statistical analysis conducted on geographies consisting of 61,605,566 people shows a poor negative correlation between the proportion of Immigrants from Micronesia and percentage of population currently divorced or separated in the United States with a correlation coefficient (R) of -0.123 and weighted average of 12.7%. Similarly, the statistical analysis conducted on geographies consisting of 279,868,346 people shows a weak negative correlation between the proportion of Immigrants from Iran and percentage of population currently divorced or separated in the United States with a correlation coefficient (R) of -0.267 and weighted average of 10.6%, a difference of 19.2%.
Divorced or Separated Correlation Summary
| Measurement | Immigrants from Micronesia | Immigrants from Iran |
| Minimum | 5.0% | 1.6% |
| Maximum | 26.9% | 21.9% |
| Range | 21.9% | 20.3% |
| Mean | 13.1% | 9.5% |
| Median | 12.8% | 10.1% |
| Interquartile 25% (IQ1) | 10.8% | 8.6% |
| Interquartile 75% (IQ3) | 15.1% | 11.1% |
| Interquartile Range (IQR) | 4.3% | 2.5% |
| Standard Deviation (Sample) | 4.0% | 3.1% |
| Standard Deviation (Population) | 3.9% | 3.1% |
Similar Demographics by Divorced or Separated
Demographics Similar to Immigrants from Micronesia by Divorced or Separated
In terms of divorced or separated, the demographic groups most similar to Immigrants from Micronesia are Bermudan (12.7%, a difference of 0.010%), Central American Indian (12.7%, a difference of 0.040%), Spaniard (12.7%, a difference of 0.10%), Immigrants from Middle Africa (12.7%, a difference of 0.12%), and Dominican (12.7%, a difference of 0.15%).
| Demographics | Rating | Rank | Divorced or Separated |
| Whites/Caucasians | 0.5 /100 | #266 | Tragic 12.6% |
| Scottish | 0.4 /100 | #267 | Tragic 12.6% |
| Fijians | 0.4 /100 | #268 | Tragic 12.6% |
| Immigrants | Liberia | 0.4 /100 | #269 | Tragic 12.6% |
| Ute | 0.4 /100 | #270 | Tragic 12.6% |
| Panamanians | 0.3 /100 | #271 | Tragic 12.7% |
| Immigrants | Middle Africa | 0.3 /100 | #272 | Tragic 12.7% |
| Immigrants | Micronesia | 0.3 /100 | #273 | Tragic 12.7% |
| Bermudans | 0.3 /100 | #274 | Tragic 12.7% |
| Central American Indians | 0.3 /100 | #275 | Tragic 12.7% |
| Spaniards | 0.2 /100 | #276 | Tragic 12.7% |
| Dominicans | 0.2 /100 | #277 | Tragic 12.7% |
| Lumbee | 0.2 /100 | #278 | Tragic 12.7% |
| Immigrants | Dominican Republic | 0.2 /100 | #279 | Tragic 12.7% |
| Immigrants | Zaire | 0.2 /100 | #280 | Tragic 12.7% |
Demographics Similar to Immigrants from Iran by Divorced or Separated
In terms of divorced or separated, the demographic groups most similar to Immigrants from Iran are Asian (10.6%, a difference of 0.0%), Immigrants from Israel (10.6%, a difference of 0.090%), Immigrants from Korea (10.6%, a difference of 0.19%), Immigrants from Armenia (10.6%, a difference of 0.63%), and Assyrian/Chaldean/Syriac (10.6%, a difference of 0.70%).
| Demographics | Rating | Rank | Divorced or Separated |
| Immigrants | South Central Asia | 100.0 /100 | #11 | Exceptional 10.4% |
| Okinawans | 100.0 /100 | #12 | Exceptional 10.5% |
| Cypriots | 100.0 /100 | #13 | Exceptional 10.5% |
| Assyrians/Chaldeans/Syriacs | 100.0 /100 | #14 | Exceptional 10.6% |
| Immigrants | Armenia | 100.0 /100 | #15 | Exceptional 10.6% |
| Immigrants | Korea | 100.0 /100 | #16 | Exceptional 10.6% |
| Immigrants | Israel | 100.0 /100 | #17 | Exceptional 10.6% |
| Immigrants | Iran | 100.0 /100 | #18 | Exceptional 10.6% |
| Asians | 100.0 /100 | #19 | Exceptional 10.6% |
| Burmese | 100.0 /100 | #20 | Exceptional 10.7% |
| Immigrants | Asia | 100.0 /100 | #21 | Exceptional 10.7% |
| Vietnamese | 100.0 /100 | #22 | Exceptional 10.8% |
| Immigrants | Pakistan | 100.0 /100 | #23 | Exceptional 10.8% |
| Immigrants | Sri Lanka | 100.0 /100 | #24 | Exceptional 10.8% |
| Iranians | 100.0 /100 | #25 | Exceptional 10.8% |