Hopi vs Slovene Single Mother Households

COMPARE

Hopi
Race
Ancestry
AfghanAfricanAlaska NativeAlaskan AthabascanAlbanianAleutAlsatianAmericanApacheArabArapahoArgentineanArmenianAssyrian/Chaldean/SyriacAustralianAustrianBahamianBangladeshiBarbadianBasqueBelgianBelizeanBermudanBhutaneseBlackfeetBolivianBrazilianBritishBritish West IndianBulgarianBurmeseCajunCambodianCanadianCape VerdeanCarpatho RusynCelticCentral AmericanCentral American IndianCherokeeCheyenneChickasawChileanChineseChippewaChoctawColombianColvilleComancheCosta RicanCreeCreekCroatianCrowCubanCypriotCzechCzechoslovakianDanishDelawareDominicanDutchDutch West IndianEastern EuropeanEcuadorianEgyptianEnglishEstonianEthiopianEuropeanFijianFilipinoFinnishFrenchFrench American IndianFrench CanadianGermanGerman RussianGhanaianGreekGuamanian/ChamorroGuatemalanGuyaneseHaitianHmongHonduranHopiHoumaHungarianIcelanderIndian (Asian)IndonesianInupiatIranianIraqiIrishIroquoisIsraeliItalianJamaicanJapaneseJordanianKenyanKiowaKoreanLaotianLatvianLebaneseLiberianLithuanianLumbeeLuxembourgerMacedonianMalaysianMalteseMarshalleseMenomineeMexicanMexican American IndianMongolianMoroccanNative HawaiianNavajoNepaleseNew ZealanderNicaraguanNigerianNorthern EuropeanNorwegianOkinawanOsageOttawaPaiutePakistaniPalestinianPanamanianParaguayanPennsylvania GermanPeruvianPimaPolishPortuguesePotawatomiPuebloPuerto RicanPuget Sound SalishRomanianRussianSalvadoranSamoanScandinavianScotch-IrishScottishSeminoleSenegaleseSerbianShoshoneSierra LeoneanSiouxSlavicSlovakSomaliSouth AfricanSouth AmericanSouth American IndianSoviet UnionSpaniardSpanishSpanish AmericanSpanish American IndianSri LankanSubsaharan AfricanSudaneseSwedishSwissSyrianTaiwaneseThaiTlingit-HaidaTohono O'OdhamTonganTrinidadian and TobagonianTsimshianTurkishU.S. Virgin IslanderUgandanUkrainianUruguayanUteVenezuelanVietnameseWelshWest IndianYakamaYaquiYugoslavianYumanYup'ikZimbabwean
Immigration
NonimmigrantsImmigrantsAfghanistanAfricaAlbaniaArgentinaArmeniaAsiaAustraliaAustriaBahamasBangladeshBarbadosBelarusBelgiumBelizeBoliviaBosnia and HerzegovinaBrazilBulgariaBurma/MyanmarCabo VerdeCambodiaCameroonCanadaCaribbeanCentral AmericaChileChinaColombiaCongoCosta RicaCroatiaCubaCzechoslovakiaDenmarkDominicaDominican RepublicEastern AfricaEastern AsiaEastern EuropeEcuadorEgyptEl SalvadorEnglandEritreaEthiopiaEuropeFijiFranceGermanyGhanaGreeceGrenadaGuatemalaGuyanaHaitiHondurasHong KongHungaryIndiaIndonesiaIranIraqIrelandIsraelItalyJamaicaJapanJordanKazakhstanKenyaKoreaKuwaitLaosLatin AmericaLatviaLebanonLiberiaLithuaniaMalaysiaMexicoMicronesiaMiddle AfricaMoldovaMoroccoNepalNetherlandsNicaraguaNigeriaNorth AmericaNorth MacedoniaNorthern AfricaNorthern EuropeNorwayOceaniaPakistanPanamaPeruPhilippinesPolandPortugalRomaniaRussiaSaudi ArabiaScotlandSenegalSerbiaSierra LeoneSingaporeSomaliaSouth AfricaSouth AmericaSouth Central AsiaSouth Eastern AsiaSouthern EuropeSpainSri LankaSt. Vincent and the GrenadinesSudanSwedenSwitzerlandSyriaTaiwanThailandTrinidad and TobagoTurkeyUgandaUkraineUruguayUzbekistanVenezuelaVietnamWest IndiesWestern AfricaWestern AsiaWestern EuropeYemenZaireZimbabweAzores
Slovene
Race
Ancestry
AfghanAfricanAlaska NativeAlaskan AthabascanAlbanianAleutAlsatianAmericanApacheArabArapahoArgentineanArmenianAssyrian/Chaldean/SyriacAustralianAustrianBahamianBangladeshiBarbadianBasqueBelgianBelizeanBermudanBhutaneseBlackfeetBolivianBrazilianBritishBritish West IndianBulgarianBurmeseCajunCambodianCanadianCape VerdeanCarpatho RusynCelticCentral AmericanCentral American IndianCherokeeCheyenneChickasawChileanChineseChippewaChoctawColombianColvilleComancheCosta RicanCreeCreekCroatianCrowCubanCypriotCzechCzechoslovakianDanishDelawareDominicanDutchDutch West IndianEastern EuropeanEcuadorianEgyptianEnglishEstonianEthiopianEuropeanFijianFilipinoFinnishFrenchFrench American IndianFrench CanadianGermanGerman RussianGhanaianGreekGuamanian/ChamorroGuatemalanGuyaneseHaitianHmongHonduranHoumaHungarianIcelanderIndian (Asian)IndonesianInupiatIranianIraqiIrishIroquoisIsraeliItalianJamaicanJapaneseJordanianKenyanKiowaKoreanLaotianLatvianLebaneseLiberianLithuanianLumbeeLuxembourgerMacedonianMalaysianMalteseMarshalleseMenomineeMexicanMexican American IndianMongolianMoroccanNative HawaiianNavajoNepaleseNew ZealanderNicaraguanNigerianNorthern EuropeanNorwegianOkinawanOsageOttawaPaiutePakistaniPalestinianPanamanianParaguayanPennsylvania GermanPeruvianPimaPolishPortuguesePotawatomiPuebloPuerto RicanPuget Sound SalishRomanianRussianSalvadoranSamoanScandinavianScotch-IrishScottishSeminoleSenegaleseSerbianShoshoneSierra LeoneanSiouxSlavicSlovakSloveneSomaliSouth AfricanSouth AmericanSouth American IndianSoviet UnionSpaniardSpanishSpanish AmericanSpanish American IndianSri LankanSubsaharan AfricanSudaneseSwedishSwissSyrianTaiwaneseThaiTlingit-HaidaTohono O'OdhamTonganTrinidadian and TobagonianTsimshianTurkishU.S. Virgin IslanderUgandanUkrainianUruguayanUteVenezuelanVietnameseWelshWest IndianYakamaYaquiYugoslavianYumanYup'ikZimbabwean
Immigration
NonimmigrantsImmigrantsAfghanistanAfricaAlbaniaArgentinaArmeniaAsiaAustraliaAustriaBahamasBangladeshBarbadosBelarusBelgiumBelizeBoliviaBosnia and HerzegovinaBrazilBulgariaBurma/MyanmarCabo VerdeCambodiaCameroonCanadaCaribbeanCentral AmericaChileChinaColombiaCongoCosta RicaCroatiaCubaCzechoslovakiaDenmarkDominicaDominican RepublicEastern AfricaEastern AsiaEastern EuropeEcuadorEgyptEl SalvadorEnglandEritreaEthiopiaEuropeFijiFranceGermanyGhanaGreeceGrenadaGuatemalaGuyanaHaitiHondurasHong KongHungaryIndiaIndonesiaIranIraqIrelandIsraelItalyJamaicaJapanJordanKazakhstanKenyaKoreaKuwaitLaosLatin AmericaLatviaLebanonLiberiaLithuaniaMalaysiaMexicoMicronesiaMiddle AfricaMoldovaMoroccoNepalNetherlandsNicaraguaNigeriaNorth AmericaNorth MacedoniaNorthern AfricaNorthern EuropeNorwayOceaniaPakistanPanamaPeruPhilippinesPolandPortugalRomaniaRussiaSaudi ArabiaScotlandSenegalSerbiaSierra LeoneSingaporeSomaliaSouth AfricaSouth AmericaSouth Central AsiaSouth Eastern AsiaSouthern EuropeSpainSri LankaSt. Vincent and the GrenadinesSudanSwedenSwitzerlandSyriaTaiwanThailandTrinidad and TobagoTurkeyUgandaUkraineUruguayUzbekistanVenezuelaVietnamWest IndiesWestern AfricaWestern AsiaWestern EuropeYemenZaireZimbabweAzores
Single Mother Households
Income
Poverty
Unemployment
Labor Participation
Family Structure
Vehicle Availability
Education Level
Disability

Single Mother Households Comparison

Hopi

Slovenes

Tragic
Exceptional
8.5%
SINGLE MOTHER HOUSEHOLDS
0.0/ 100
METRIC RATING
329th/ 347
METRIC RANK
5.6%
SINGLE MOTHER HOUSEHOLDS
98.3/ 100
METRIC RATING
75th/ 347
METRIC RANK

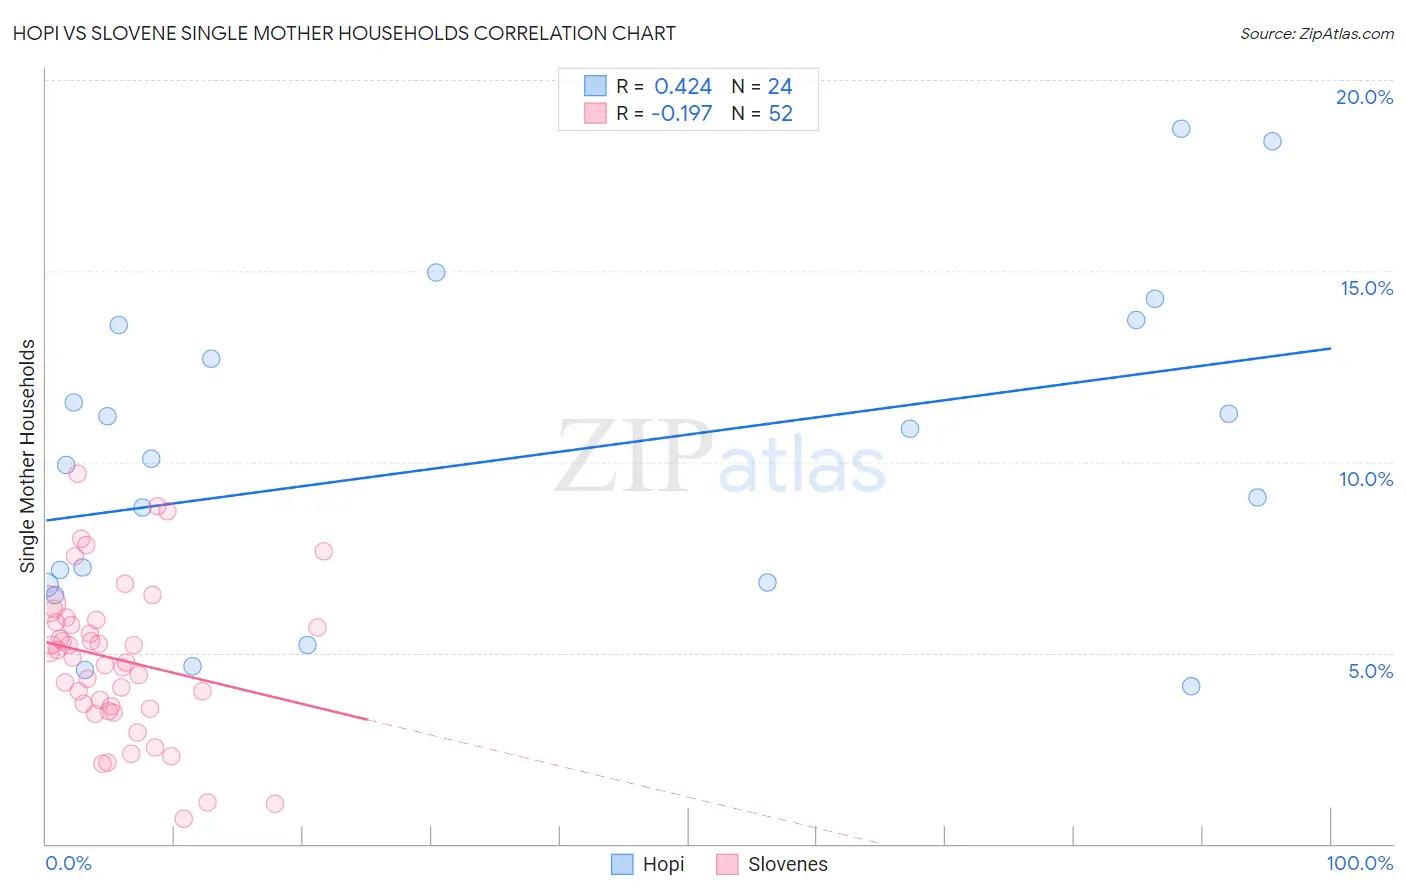
Hopi vs Slovene Single Mother Households Correlation Chart

The statistical analysis conducted on geographies consisting of 74,699,653 people shows a moderate positive correlation between the proportion of Hopi and percentage of single mother households in the United States with a correlation coefficient (R) of 0.424 and weighted average of 8.5%. Similarly, the statistical analysis conducted on geographies consisting of 260,631,294 people shows a poor negative correlation between the proportion of Slovenes and percentage of single mother households in the United States with a correlation coefficient (R) of -0.197 and weighted average of 5.6%, a difference of 50.9%.
Hopi vs Slovene Single Mother Households

Single Mother Households Correlation Summary

MeasurementHopiSlovene
Minimum4.1%0.67%
Maximum18.7%9.7%
Range14.6%9.0%
Mean10.1%4.8%
Median10.0%5.0%
Interquartile 25% (IQ1)6.8%3.6%
Interquartile 75% (IQ3)13.1%5.8%
Interquartile Range (IQR)6.4%2.2%
Standard Deviation (Sample)4.2%2.0%
Standard Deviation (Population)4.1%2.0%

Similar Demographics by Single Mother Households

Demographics Similar to Hopi by Single Mother Households

In terms of single mother households, the demographic groups most similar to Hopi are Inupiat (8.5%, a difference of 0.11%), Sioux (8.5%, a difference of 0.11%), Yakama (8.4%, a difference of 0.75%), Immigrants from Haiti (8.4%, a difference of 0.92%), and British West Indian (8.4%, a difference of 1.1%).
DemographicsRating | RankSingle Mother Households
Pima
0.0
/100
|
#322
Tragic
8.3%
Haitians
0.0
/100
|
#323
Tragic
8.3%
Immigrants | Jamaica
0.0
/100
|
#324
Tragic
8.4%
Immigrants | Caribbean
0.0
/100
|
#325
Tragic
8.4%
British West Indians
0.0
/100
|
#326
Tragic
8.4%
Immigrants | Haiti
0.0
/100
|
#327
Tragic
8.4%
Yakama
0.0
/100
|
#328
Tragic
8.4%
Hopi
0.0
/100
|
#329
Tragic
8.5%
Inupiat
0.0
/100
|
#330
Tragic
8.5%
Sioux
0.0
/100
|
#331
Tragic
8.5%
U.S. Virgin Islanders
0.0
/100
|
#332
Tragic
8.6%
Liberians
0.0
/100
|
#333
Tragic
8.6%
Immigrants | Liberia
0.0
/100
|
#334
Tragic
8.7%
Immigrants | Dominica
0.0
/100
|
#335
Tragic
8.7%
Puerto Ricans
0.0
/100
|
#336
Tragic
8.7%

Demographics Similar to Slovenes by Single Mother Households

In terms of single mother households, the demographic groups most similar to Slovenes are New Zealander (5.6%, a difference of 0.070%), Immigrants from North America (5.6%, a difference of 0.14%), Immigrants from Asia (5.6%, a difference of 0.17%), Immigrants from Netherlands (5.6%, a difference of 0.23%), and Romanian (5.6%, a difference of 0.25%).
DemographicsRating | RankSingle Mother Households
Immigrants | Bulgaria
98.5
/100
|
#68
Exceptional
5.6%
Asians
98.5
/100
|
#69
Exceptional
5.6%
Immigrants | Eastern Europe
98.4
/100
|
#70
Exceptional
5.6%
Immigrants | Kazakhstan
98.4
/100
|
#71
Exceptional
5.6%
Immigrants | Netherlands
98.4
/100
|
#72
Exceptional
5.6%
Immigrants | Asia
98.4
/100
|
#73
Exceptional
5.6%
Immigrants | North America
98.3
/100
|
#74
Exceptional
5.6%
Slovenes
98.3
/100
|
#75
Exceptional
5.6%
New Zealanders
98.2
/100
|
#76
Exceptional
5.6%
Romanians
98.1
/100
|
#77
Exceptional
5.6%
Swiss
98.1
/100
|
#78
Exceptional
5.6%
Immigrants | Sri Lanka
98.0
/100
|
#79
Exceptional
5.6%
Czechs
97.9
/100
|
#80
Exceptional
5.6%
Immigrants | Moldova
97.9
/100
|
#81
Exceptional
5.6%
Immigrants | Malaysia
97.8
/100
|
#82
Exceptional
5.7%