Cuban vs Cajun Divorced or Separated
COMPARE
Cuban
Cajun
Divorced or Separated
Divorced or Separated Comparison
Cubans
Cajuns
14.5%
DIVORCED OR SEPARATED
0.0/ 100
METRIC RATING
344th/ 347
METRIC RANK
13.4%
DIVORCED OR SEPARATED
0.0/ 100
METRIC RATING
320th/ 347
METRIC RANK
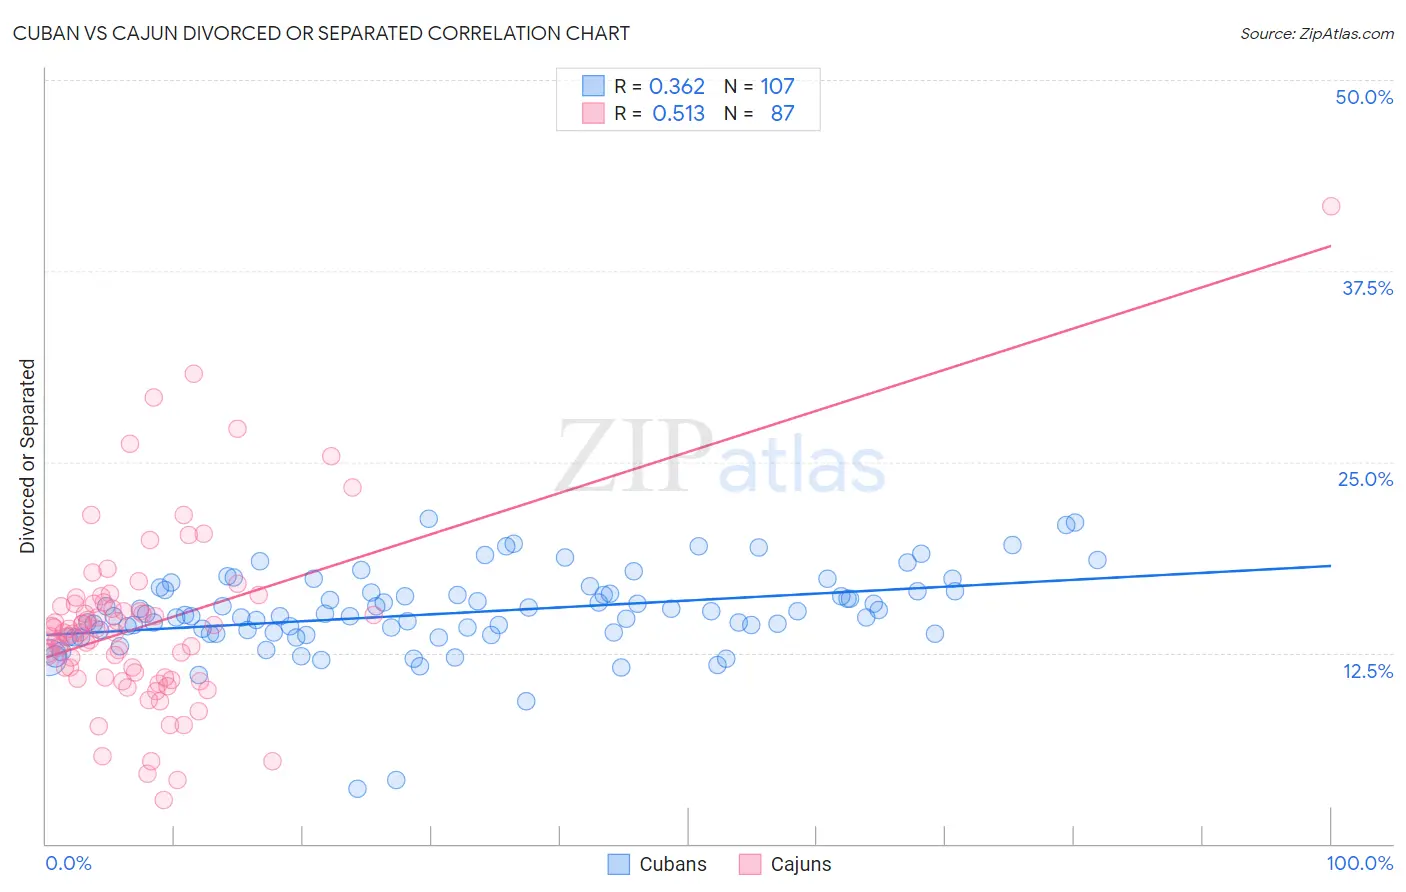
Cuban vs Cajun Divorced or Separated Correlation Chart
The statistical analysis conducted on geographies consisting of 449,144,755 people shows a mild positive correlation between the proportion of Cubans and percentage of population currently divorced or separated in the United States with a correlation coefficient (R) of 0.362 and weighted average of 14.5%. Similarly, the statistical analysis conducted on geographies consisting of 149,704,067 people shows a substantial positive correlation between the proportion of Cajuns and percentage of population currently divorced or separated in the United States with a correlation coefficient (R) of 0.513 and weighted average of 13.4%, a difference of 8.5%.
Divorced or Separated Correlation Summary
| Measurement | Cuban | Cajun |
| Minimum | 3.6% | 2.9% |
| Maximum | 21.3% | 41.7% |
| Range | 17.7% | 38.8% |
| Mean | 15.1% | 14.3% |
| Median | 14.9% | 13.8% |
| Interquartile 25% (IQ1) | 13.8% | 10.9% |
| Interquartile 75% (IQ3) | 16.5% | 15.7% |
| Interquartile Range (IQR) | 2.7% | 4.9% |
| Standard Deviation (Sample) | 2.8% | 5.9% |
| Standard Deviation (Population) | 2.7% | 5.9% |
Similar Demographics by Divorced or Separated
Demographics Similar to Cubans by Divorced or Separated
In terms of divorced or separated, the demographic groups most similar to Cubans are Kiowa (14.5%, a difference of 0.10%), Creek (14.4%, a difference of 0.68%), Seminole (14.3%, a difference of 1.7%), Bahamian (14.2%, a difference of 1.9%), and Chickasaw (14.2%, a difference of 2.1%).
| Demographics | Rating | Rank | Divorced or Separated |
| Puerto Ricans | 0.0 /100 | #333 | Tragic 13.9% |
| Immigrants | Bahamas | 0.0 /100 | #334 | Tragic 13.9% |
| Dutch West Indians | 0.0 /100 | #335 | Tragic 14.0% |
| Shoshone | 0.0 /100 | #336 | Tragic 14.0% |
| Crow | 0.0 /100 | #337 | Tragic 14.1% |
| Choctaw | 0.0 /100 | #338 | Tragic 14.1% |
| Colville | 0.0 /100 | #339 | Tragic 14.2% |
| Chickasaw | 0.0 /100 | #340 | Tragic 14.2% |
| Bahamians | 0.0 /100 | #341 | Tragic 14.2% |
| Seminole | 0.0 /100 | #342 | Tragic 14.3% |
| Creek | 0.0 /100 | #343 | Tragic 14.4% |
| Cubans | 0.0 /100 | #344 | Tragic 14.5% |
| Kiowa | 0.0 /100 | #345 | Tragic 14.5% |
| Arapaho | 0.0 /100 | #346 | Tragic 14.8% |
| Immigrants | Cuba | 0.0 /100 | #347 | Tragic 15.2% |
Demographics Similar to Cajuns by Divorced or Separated
In terms of divorced or separated, the demographic groups most similar to Cajuns are Puget Sound Salish (13.4%, a difference of 0.060%), Cree (13.4%, a difference of 0.10%), Cheyenne (13.4%, a difference of 0.10%), Haitian (13.3%, a difference of 0.12%), and Tsimshian (13.3%, a difference of 0.14%).
| Demographics | Rating | Rank | Divorced or Separated |
| Immigrants | Nicaragua | 0.0 /100 | #313 | Tragic 13.3% |
| Yaqui | 0.0 /100 | #314 | Tragic 13.3% |
| Spanish Americans | 0.0 /100 | #315 | Tragic 13.3% |
| Tsimshian | 0.0 /100 | #316 | Tragic 13.3% |
| Haitians | 0.0 /100 | #317 | Tragic 13.3% |
| Cree | 0.0 /100 | #318 | Tragic 13.4% |
| Puget Sound Salish | 0.0 /100 | #319 | Tragic 13.4% |
| Cajuns | 0.0 /100 | #320 | Tragic 13.4% |
| Cheyenne | 0.0 /100 | #321 | Tragic 13.4% |
| Immigrants | Haiti | 0.0 /100 | #322 | Tragic 13.4% |
| U.S. Virgin Islanders | 0.0 /100 | #323 | Tragic 13.4% |
| Osage | 0.0 /100 | #324 | Tragic 13.4% |
| Potawatomi | 0.0 /100 | #325 | Tragic 13.5% |
| Immigrants | Congo | 0.0 /100 | #326 | Tragic 13.5% |
| Comanche | 0.0 /100 | #327 | Tragic 13.5% |