Immigrants from Australia vs Hungarian Single Mother Households
COMPARE
Immigrants from Australia
Hungarian
Single Mother Households
Single Mother Households Comparison
Immigrants from Australia
Hungarians
5.1%
SINGLE MOTHER HOUSEHOLDS
99.9/ 100
METRIC RATING
14th/ 347
METRIC RANK
5.7%
SINGLE MOTHER HOUSEHOLDS
97.6/ 100
METRIC RATING
85th/ 347
METRIC RANK
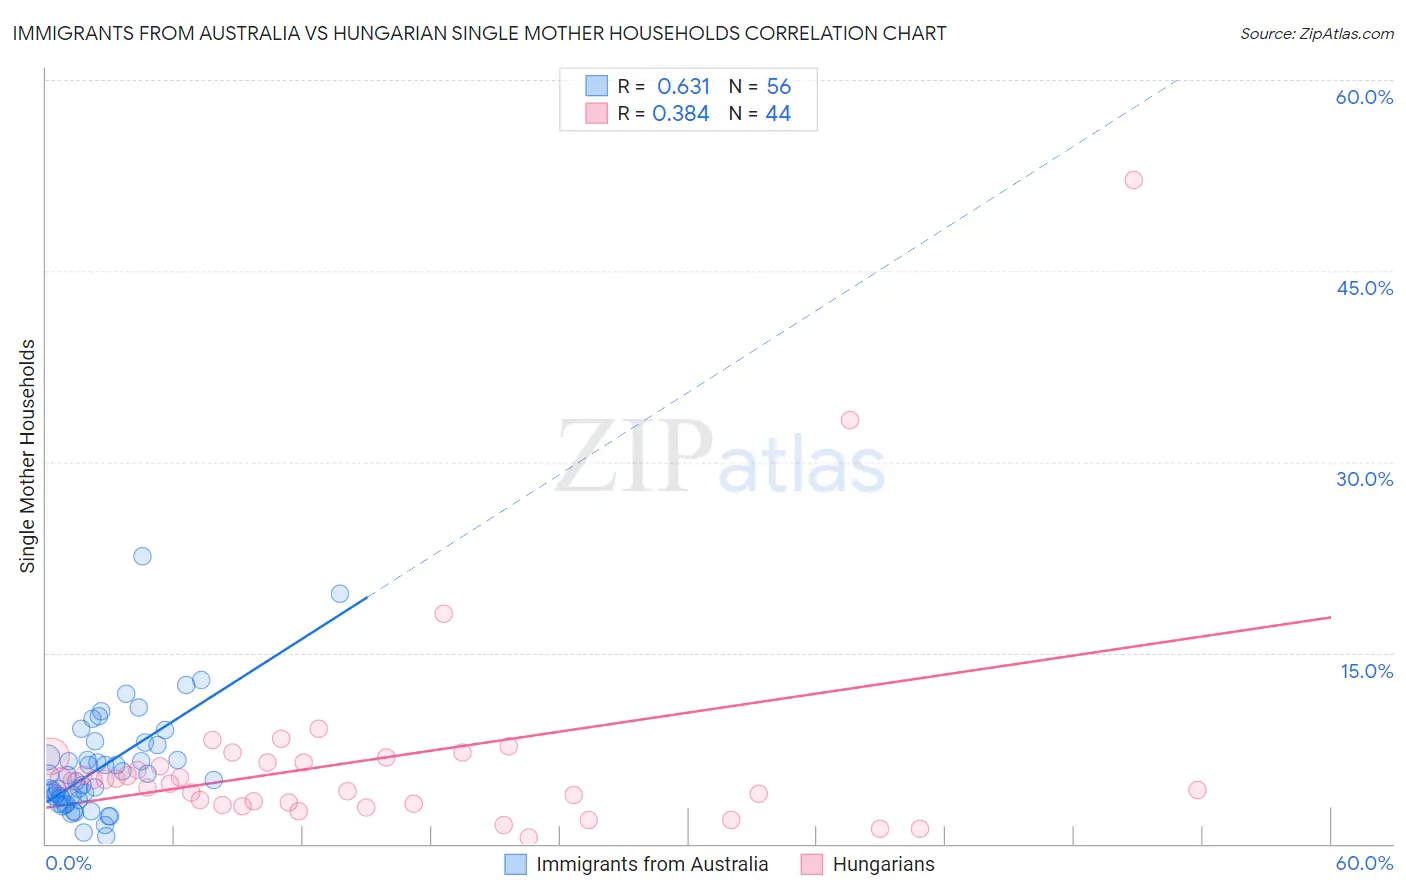
Immigrants from Australia vs Hungarian Single Mother Households Correlation Chart
The statistical analysis conducted on geographies consisting of 226,768,478 people shows a significant positive correlation between the proportion of Immigrants from Australia and percentage of single mother households in the United States with a correlation coefficient (R) of 0.631 and weighted average of 5.1%. Similarly, the statistical analysis conducted on geographies consisting of 483,597,168 people shows a mild positive correlation between the proportion of Hungarians and percentage of single mother households in the United States with a correlation coefficient (R) of 0.384 and weighted average of 5.7%, a difference of 11.4%.
Single Mother Households Correlation Summary
| Measurement | Immigrants from Australia | Hungarian |
| Minimum | 0.54% | 0.48% |
| Maximum | 22.6% | 52.2% |
| Range | 22.0% | 51.7% |
| Mean | 6.0% | 6.6% |
| Median | 5.0% | 4.9% |
| Interquartile 25% (IQ1) | 3.5% | 3.2% |
| Interquartile 75% (IQ3) | 7.3% | 6.6% |
| Interquartile Range (IQR) | 3.8% | 3.4% |
| Standard Deviation (Sample) | 4.1% | 8.7% |
| Standard Deviation (Population) | 4.1% | 8.6% |
Similar Demographics by Single Mother Households
Demographics Similar to Immigrants from Australia by Single Mother Households
In terms of single mother households, the demographic groups most similar to Immigrants from Australia are Immigrants from Eastern Asia (5.1%, a difference of 0.090%), Indian (Asian) (5.1%, a difference of 0.28%), Immigrants from India (5.1%, a difference of 0.32%), Cypriot (5.1%, a difference of 0.45%), and Soviet Union (5.1%, a difference of 0.49%).
| Demographics | Rating | Rank | Single Mother Households |
| Iranians | 100.0 /100 | #7 | Exceptional 5.0% |
| Immigrants | Ireland | 99.9 /100 | #8 | Exceptional 5.0% |
| Okinawans | 99.9 /100 | #9 | Exceptional 5.0% |
| Immigrants | Israel | 99.9 /100 | #10 | Exceptional 5.0% |
| Immigrants | China | 99.9 /100 | #11 | Exceptional 5.1% |
| Cypriots | 99.9 /100 | #12 | Exceptional 5.1% |
| Immigrants | India | 99.9 /100 | #13 | Exceptional 5.1% |
| Immigrants | Australia | 99.9 /100 | #14 | Exceptional 5.1% |
| Immigrants | Eastern Asia | 99.9 /100 | #15 | Exceptional 5.1% |
| Indians (Asian) | 99.9 /100 | #16 | Exceptional 5.1% |
| Soviet Union | 99.9 /100 | #17 | Exceptional 5.1% |
| Immigrants | Armenia | 99.9 /100 | #18 | Exceptional 5.2% |
| Chinese | 99.9 /100 | #19 | Exceptional 5.2% |
| Maltese | 99.9 /100 | #20 | Exceptional 5.2% |
| Eastern Europeans | 99.8 /100 | #21 | Exceptional 5.2% |
Demographics Similar to Hungarians by Single Mother Households
In terms of single mother households, the demographic groups most similar to Hungarians are Finnish (5.7%, a difference of 0.030%), Immigrants from Turkey (5.7%, a difference of 0.11%), Carpatho Rusyn (5.7%, a difference of 0.15%), Israeli (5.7%, a difference of 0.18%), and Immigrants from Hungary (5.7%, a difference of 0.23%).
| Demographics | Rating | Rank | Single Mother Households |
| Swiss | 98.1 /100 | #78 | Exceptional 5.6% |
| Immigrants | Sri Lanka | 98.0 /100 | #79 | Exceptional 5.6% |
| Czechs | 97.9 /100 | #80 | Exceptional 5.6% |
| Immigrants | Moldova | 97.9 /100 | #81 | Exceptional 5.6% |
| Immigrants | Malaysia | 97.8 /100 | #82 | Exceptional 5.7% |
| Immigrants | Hungary | 97.8 /100 | #83 | Exceptional 5.7% |
| Carpatho Rusyns | 97.7 /100 | #84 | Exceptional 5.7% |
| Hungarians | 97.6 /100 | #85 | Exceptional 5.7% |
| Finns | 97.6 /100 | #86 | Exceptional 5.7% |
| Immigrants | Turkey | 97.5 /100 | #87 | Exceptional 5.7% |
| Israelis | 97.4 /100 | #88 | Exceptional 5.7% |
| Ukrainians | 97.2 /100 | #89 | Exceptional 5.7% |
| Immigrants | Indonesia | 97.2 /100 | #90 | Exceptional 5.7% |
| Europeans | 97.0 /100 | #91 | Exceptional 5.7% |
| Immigrants | Western Asia | 96.7 /100 | #92 | Exceptional 5.7% |